
![]()
Dr. Sriram Simakurthy, S18123, Dr. Raghav D. Ravani, Dr. Atul Kumar
ABSTRACT
Purpose: To assess the role of intravitreal Bone Marrow-derived Mononuclear Stem Cells (BM-MNCs) in patients with Advanced Dry Age-related Macular Degeneration (d AMD) and quantitatively analyse it using a newer modality – advanced retinal pigment epithelium(RPE) analysis.
Methods: This was aprospective interventional non randomized clinical trial. 25patients with bilateral advanced dAMD were recruited for intravitreal injection of autologous BM-MNCs. The patients were evaluated at presentation and during follow-up visits on 1, 3, 6 and 9 months to look for the course of the disease, complications if any and response over the period using Fundus Auto Fluorescence (FAF), multifocal ERG (mf ERG) and advanced RPE analysis. The fellow eye was taken as control.
Results:The procedure was well tolerated without any adverse effects or decrease in best corrected visual acuity in cases. A statistically significant decrease was noted in area and greatest linear dimension (GLD) of geographic atrophy at 9 months follow up after injection from 7.6 mm2 to 4.98 mm2 (P = 0.002) and 5.39 mm to 5.17 mm (P< 0.001). Improvement in mf ERG was seen as a statistically significant increase in amplitude and decrease in implicit time in cone dominated ring1 (<20).
Conclusions: Autologous BM-MNCs transplantation by intravitreal injection is a safe option in treatment of advanced dry AMD and may help preserve degenerating retina as evident on mf ERG, FAF, and advanced RPE analysis. Advanced RPE analysis is an effective tool to determine response to newer treatment modalities in dry AMD.
Keywords: Advanced RPE analysis,dry Age-related Macular Degeneration, fundus autofluorescence (FAF), multifocal electroretinogram (mf ERG), Stem cells.
INTRODUCTION
Age-related Macular Degeneration (AMD) is one of the leading causes of low vision in the elderly population in developed nations [1] and it is defined as a chronic, progressive disorder characterized by changes occurring within the macula reflective of the ageing process. The classification system proposed by Age- Related Eye Disease Study is now increasingly used to classify AMD. [2]Advanced or late AMD can be either non-neovascular (dry, atrophic, or non-exudative) or neovascular (wet or exudative). Advanced non – neovascular AMD is characterized by drusen and geographic atrophy extending to the center of the macula while advanced neovascular AMD is characterized by choroidal neovascularization and its sequelae.In late stages of AMD, there is severe visual impairment.[3]The prevalence of AMD in developing countries like India is increasing, with the prevalence of late AMD being comparable to that of the western populations in the age group 60-79 years[4] and is estimated to increase by a third by 2020.
Factors that may increase the risk for occurrence of AMD includes genetic defects including SNPs (Single Nucleotide Polymorphisms) associated with various genes e.g. CFH, CFB, C2, ARMS2 etc. [5, 6] age, smoking and nutritional factors. Although vitamin supplementation can slow the progression of dry AMD in advanced forms, [3]their evaluation of efficacy against dry AMD turns out to be difficult and time-consuming. Currently, no definitive treatment is available that can reverse dry AMD. Given that diseased RPE is the major component of AMD, attempts have been made to replace the RPE at the macula, either by moving diseased macula to the periphery or by grafting new RPE under the macula. Macular translocation and RPE transplantation are complex, lengthy and expensive procedures that often require further surgeries to address complications such as unplanned retinal detachment, cataracts, and double vision. To overcome this, it will be necessary to develop new techniques to derive and expand RPE cells in vitro or to use the paracrine effect of stem cells to trigger rejuvenation.
Currently, Cell-based therapy has gained a momentum in the treatment of AMD. The neuroretina is a complex structure whose health depends on blood vessels and retinal pigment epithelium (RPE), each of which is affected differently in the spectrum of retinal disease.[7] Degeneration of neural cells in the retina is a hallmark of several ocular diseases such as Retinitis Pigmentosa, where loss of photoreceptors is a primary event or dry AMD, where there is a loss of photoreceptors secondary to damage to RPE.[8,9]Therefore three distinct cell types which are conceivable targets for cell therapy in the retina are – neuroretina (photoreceptors, bipolar cells, and ganglion cells), retinal pigment epithelium and vascular endothelial cells. The therapeutic application of stem cells is based on a variety of strategies, the most well-known of which is cell replacement therapy where exvivo differentiated stem cells are delivered to the damaged tissue in order to integrate and restore function. An alternative method is via a paracrine effect, whereby the transplanted stem cells secrete trophic factors that induce the resident tissue to self-restore and proliferate. [10] In the trophic approach, the stem cells remain undifferentiated and are intended to repair the injured tissue or preserve function by altering the cellular microenvironment either by releasing cytokines or cell-to-cell interactions. [11]
Other than clinical examination with an indirect ophthalmoscope, imaging modalities like spectral domain optical coherence tomography (SD-OCT) , fundus fluorescein angiography (FFA) and fundus auto-fluorescence imaging (FAF)[12]with a confocal scanning laser ophthalmoscope are established modalities used for evaluation of patients with AMD and there is no clear consensus about the best method.[13] This study uses and describes advanced RPE analysis as a tool to monitor the response of the treatment. Using Advanced RPE analysis software (Cirrus 6.0) the status of the RPE can be objectively and automatically examined in detail and can be followed over time.[14] The major advantage of SD-OCT imaging lies in using only one type of scan for documenting both en-face and cross-sectional images of the retina. It, therefore, provides more detailed insight in retinal alterations of geographic atrophy patients than FAF. [15] Drusen area and volume, as well as area of geographic atrophy, can be measured and analysis results are presented along with calculated values in two clearly arranged screens. [16]Similarly response to treatment can be assessed using mf ERG by observing the changes in amplitude and implicit time. [17]
In the last decade, numerous advancements have been made in the treatment of neovascular AMD with good results. However treatment of advanced forms of dry AMD i.e. geographic atrophy still remains a grey area and there is a dire need for developing an effective treatment.
METHODS
This study was approved by institute ethics Committee, and was carried out at our Centre in association with the dept. of Stem cell facility and Haematology. A total of 25patients with bilateral advanced dry AMD with geographic atrophy were recruited. Written informed consent was taken from every patient and also the attendants of the patient, format of which was approved by the Institute Ethic Committee (IEC-AIIMS) and Institute Committee for Stem Cell Research and Therapy (ICSCRT).Inclusion criteria included a diagnosed case of dry advanced AMD with age ≥ 50 years, with stable or downhill clinical course over 6 months, with BCVA <6/60 (20/200), with media clarity, pupillary dilatation and patient cooperation sufficient for examination. Exclusion criteria were optic disc disease like glaucoma, optic atrophy from other causes, macular oedema, neovascularAMD, and bleeding disorders.
The eye with worse vision or more severe disease in case of similar vision in both eyes fulfilling the inclusion criteria was selected for injection of stem cells and the fellow eye was taken as control. The decision for intervention was taken by the principal investigator.
Data collection:
Visual function assessment:
Best corrected visual acuity was assessed on a log MAR (logarithm of the minimum angle of resolution) scale by using backlit Early Treatment Diabetic Retinopathy Study chart.
Advanced RPE Analysis:The Advanced RPE analysis software is part of the new cirrus 6.0™ HD OCT (Carl Zeiss Meditec AG) providing two new algorithms and allows for the detection of morphologic alterations over time, which should – in conjunction with functional testing – aid in the stratification of stages of disease progression.[18] It provides simultaneous measurement of geographic atrophy along with three-dimensional visualization of the RPE and thus can comfortably be used to gain new insight into microstructural changes underlying disease progression.
Patients were dilated with 1% Tropicamide eye drops and a macular cube scan 512*128 was performed. Using automated Advanced RPE analysis software, the data was recorded with fovea well centred on imaging at the initial visit and each of the follow-up scans. An automated fovea localization algorithm assures that measurements from regions within circles of 3 and 5 mm centred on the fovea are compared, and as data of prior and current visit are placed side by side, changes between visits are easily detectable and can be followed over time. The area of sub RPE illumination denotes area of GA.
Multifocal Electroretinogram: mf ERG recording was done using Monpack3™ (Metrovision).Standard mf ERG recording in a fully dilated light adapted state was done for 5 minutes with monocular stimulation, (other eye occluded using occluder) following ISCEV guidelines, using fixation target – MERG61BF to check for fixation and done at viewing distance of 33 cm corresponding to a field of 30º horizontally and 24º vertically, flashed in a pseudorandom pattern on a dark background cover with a luminance of 30 cd/m2 at a frequency of 17 Hz to optimize the amplitude of responses.[19] Serial records were analysed to check for any change in parameters.
Fundus Auto Fluorescence:
The procedure was carried out using VISUPAC™ (Carl Zeiss Meditec AG). The patient was dilated using 1% Tropicamide eye drops and FAF images were recorded using a blue filter. Areas of hypo-auto fluorescence in the macular region were taken as Geographic Atrophy. The greatest dimension of this hypo- auto fluorescent area was measured and noted as GLD (greatest linear dimension) at baseline, which was then followed up in each follow-up using the inbuilt software.
Bone marrow aspiration:
The procedure was carried out in Haematology department using a standard protocol where the patient was placed in the lateral decubitus position, with the top leg flexed and the lower leg straight. The site was prepared, cleaned with an antiseptic (Betadine) scrub, and draped, exposing the iliac crest. The skin and the area down to the periosteum was infiltrated with a local anaesthetic (approximately 10 cc of 1% Xylocaine was used). The BM aspiration needle, with a stylet in place, was inserted, advanced by rotating clockwise and counter clockwise slowly until the cortical bone was penetrated and the marrow cavity was entered, once within the marrow cavity, the stylet was removed, and approximately 25 to 35 cc of Bone Marrow was aspirated.
Bone marrow processing:
All open cell handling procedures were performed in Stem cell facility, AIIMS following Current Good Manufacturing Practice (cGMP) guidelines and standard protocol under aseptic precautions The bone marrow-derived mononuclear cells (MNC) were separated by Ficoll density separation method and the sample was then diluted 1:3 with phosphate buffer saline (PBS). Bone marrow aspirate was layered over lymphocyte separation medium or Ficoll medium (Specific gravity 1.077) in 50 ml Falcon tube and centrifuged at a speed of 1800 rpm for 30 min. After centrifugation, the interface cells forming the whitish ring (buffy layer) were aspirated in a separate tube. The rest of the product was kept aside in a sterile container. The trace of ficoll was removed by three heparinized normal saline washes. Supernatant of each wash was kept in a sterile container till final product, a cell pellet was re-suspended in 1 ml syringe. The final cell concentration of 8 million mononuclear cells per 0.1 ml was achieved.
Mononuclear Cells Evaluation
The aliquot of harvested mononuclear cells was evaluated for viability ( Trypan blue dye exclusion test), morphology using Giemsa stain (figure 1), cell count using Neubaur chamber and was characterized using antibodies directed against CD-34 flow cytometry (figure 2).
Figure 1 Representative Light Microscope Image of Giemsa-stained MNCs (left) a. 10x magnification image (middle) b. 40x magnification image (right) c. 100x magnification image
Flow Cytometry
Around 0.5 × 10⁶ MNCs from bone marrow were stained with CD-34 for 30 minutes at 4ºC. Parallel appropriate isotope controls were also stained. All samples were rinsed twice in PBS and analysed on a FACS LSR-II (BD Biosciences) and analysed using software FACS DIVA 6.12 (BD Biosciences). At least 10,000 cells in total were analysed (Figure2).
Figure 2 Representative plot for CD34 enumeration. Quantification of MNCs by flow cytometry. Cell distribution based on FSC (forward scatters) and SSC (side scatter) parameter that describe their size and granularity
Sterility
An aliquot of bone marrow and isolated mononuclear cells was sent for microbiological culture evaluation. The results of microbial cultures were reviewed by the laboratory in charge in a timely manner.
Intravitreal Injection
BM-MNC were suspended in physiological saline to a concentration of 8 million cells in 0.1 ml and were injected into the mid-vitreous with the help of 26G needle by the pars plana route under topical anaesthesia under aseptic precautions. Any sign of infection like endophthalmitis, intraocular pressure elevation, vitreous haemorrhage, cataract development or progression and anterior chamber reaction was noted on subsequent follow-ups.
RESULTS
The mean volume of bone marrow aspirate was 25 ±8 ml. The total cell count was 8 million per 0.1 ml normal saline with viability being 98 ±1%. No growth of microorganisms was noted in any of the cultures in our study.
Twenty five patients (15 male and 10 female) with a mean age of 64.4 years were included in the study. The eye in which intravitreal stem cell injection was given was considered as case and the fellow eye as a control. No sign of infection like endophthalmitis, intraocular pressure elevation, vitreous haemorrhage, cataract development or progression and anterior chamber reaction was noted on subsequent follow-ups in post stem cell injection in patients.
There was no significant change in mean Best-corrected visual acuity (BCVA) from pre-injection value of 1.24 0.28(20/347.5) as compared to the post injection value of 1.11 0.41(20/257.6) at 9 months of follow-up (P = 0.07) (Paired t test). (Table 1)
Table 1: Best corrected visual acuity – cases and controls
Advanced RPE analysis:
There was a statistically significant decrease in the size of geographic atrophy as measured by advanced RPE analysis with pre-injection mean value of 7.6mm2decreasing to 4.98 mm2at 9 months post procedure (P= 0.002)( Wilcoxon signed rank test). The improvement was noticed to be stable at 9 months follow-up of patients. (Table 2)
Table 2: sub-RPE illumination– cases and controls
Figure 3aChange in Sub-RPE illumination in control on two consecutive visits
Figure 3b Change in Sub-RPE illumination in case on two consecutive visits
Multifocal ERG
Analysis of mf ERG in cases showed improvement at 9 months as noted by a statistically significantincrease in amplitude in ring 1(<20) from a baseline value of 500.85nV/deg2 to 586.98nV/deg2 and 3(5 – 100) from a baseline value of 311.19nV/deg2 to 454.8nV/deg2 (P= 0.03 & 0.001 respectively, Wilcoxon signed rank test) and decrease in implicit time in ring 1(<20)from a baseline value of 48.06 msec to 42.7 msec &5 (>150) from a baseline value of 48.34 msec to 43.98 msec(P= 0.013 & 0.001 respectively, Paired t test), while in control group there was decrease in mean amplitude in all the rings. (Table 3&4). The change in implicit time in the control group was not significant.
Table 3: mf ERG amplitude (nV/deg2) – cases and controls
Table 4: mf ERG implicit time (msec) – cases and controls
Fundus Auto Fluorescence
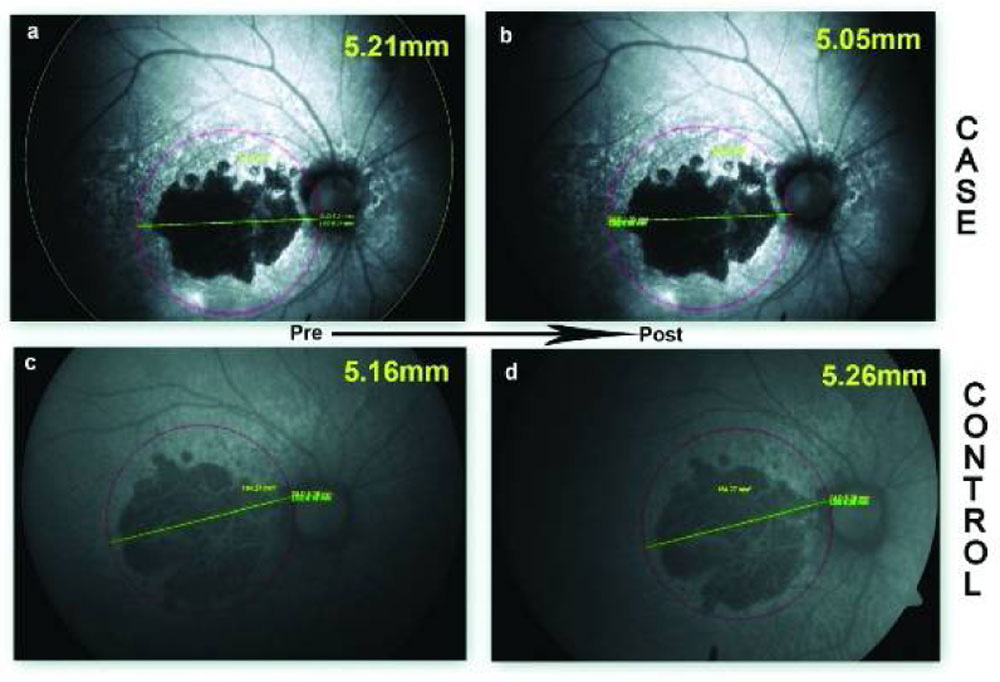
In the group receiving the intravitreal injection, the median GLD decreased from 5.39mm at baseline to 5.17mm at 9 months as measured by FAF imaging. The decrease in the size of geographic atrophy in case group was statistically significant with P<0.001(Wilcoxon signed rank test). In the control group, the median GLD increased from 5.06mm at baseline to 5.35mm at 9 months.
Figure 4 Change in greatest linear dimension of geographic atrophy – case and control. (a) greatest linear dimension of a case prior to intervention. (b) greatest linear dimension of same case 9 months post intervention. (c) greatest linear dimension of a control prior to intervention. (d) greatest linear dimension of same control on 9 months follow up.
Table 5: change in greatest linear dimension of geographic atrophy – case and controls
DISCUSSION
The use of autologous bone marrow derived stem cells for retinal degeneration offers neuroprotection and rescue from degeneration without immune rejection. In this study, we utilized autologous BM-MNCs in cases with advanced dry AMD and evaluated the change in above mentioned parameters at various follow-ups. We injected 8 million mononuclear cells/ 0.1 ml and is based on available preclinical safety data, that is, 10 million mononuclear cells per eye. [20]Both the bone marrow aspiration and intravitreal injection were well tolerated without any ocular and systemic adverse effects. Our findings were consistent with previously done preclinical study in NOD-SCID mice showing no long term ocular or systemic safety concerns associated with intravitreally injected BM cells. [21]
Intravitreal injection of CD 34+ cells results in homing of these cells into the damaged retinal tissue. Trans retinal migration of these CD 34+ cells into the outer retina has been demonstrated by Calzi et al in an animal model of laser retinal injury. [22]
In this clinical study, histopathological analysis to confirm the intraretinal incorporation of these CD34+ cells following intravitreal injection was not possible as was done in animal studies carried out by Otani et al. [23] The intravitreally injected bone marrow stem cells help in preserving the degenerating retina in more than one way. As shown by Otani et al stem cells cause significant up-regulation of many antiapoptotic genes, including small heat shock proteins and transcription factors in the two mouse models of retinal degeneration, rdl, and rdl0. Second, the injected stem cells may differentiate into retinal neural cells as shown by Tomita et al.[24] Intravitreal route of injection is a safe procedure and its clinical feasibility has been shown in previous studies done by Jonas et al, Park et al and Kumar A et al.[25,26,27]
In our study we used intravitreal injection of autologous bone marrow derived mononuclear stem cells, while in an another study done in Asian population by Song WK et al[28] using sub retinal injection of embryonic stem cells in dry AMD showed similar improvement in vision in treated eye, with deterioration in the control group. However, a longer duration of study is required to assess the effect on visual acuity. Advanced RPE analysis of post stem cell injection in dry AMD patients showed decrease in the area of geographic atrophy at 9 months follow-up period in the intervention group, along with a decrease in greatest linear dimension of geographic atrophy (mm) measured by FAF and improvement in implicit time in ring 5 in mf ERG. The effect of stem cells on geographic atrophy size can be explained by homing of stem cells to the injured retinal sites and stabilization of retinal vasculature and RPE by trophic effects, preventing further increase in the area of atrophy. The predominantly rescued cells in Stem cells injected eyes were the cone photoreceptors in the mouse model of rd1 and rd10 in Otani and colleagues study. There is an improvement noted in mfERG in cases, which is a cone-derived response and correlates well with histopathological examination of mice retinas in Otani experiment.
With the new Advanced RPE analysis software that allows automated, quantitative assessment of atrophic lesions along with temporal monitoring of disease progression, the efficacy of various modalities used in future similar clinical trials could be assessed quantitatively using the tool.
However, the long-term efficacy and dose standardization of autologous bone marrow derived mononuclear stem cell injections is still to be determined.
In conclusion this study shows that autologous Bone Marrow-derived mononuclear stem cells transplantation by intravitreal injection is a safe procedure and promising therapy in retinal degenerations like dry AMD as evident by the decrease in GA over time and a significant improvement on advanced RPE analysis and mf ERG. Advanced RPE analysis is an effective tool to determine the stage, prognosis as well as response to various newer treatment modalities in dry AMD.
DISCLOSURES
Funding/support: This research did not receive any specific grant from funding agencies in the public, commercial, or not for project sectors.
Conflict of interest: None of the authors has conflict of interest with this submission.
REFERENCES
- Ferris 3rd, F. L. Senile Macular Degeneration: Review of Epidemiologic Features. American Journal of Epidemiology. 1983; 118(2):132-151.
- The age-related eye disease study system for classifying age-related macular degeneration from stereoscopic color fundus photographs: the age-related eye disease study report number 6. American Journal of Ophthalmology. 2001; 132(5):668-681.
- A Randomized, Placebo-Controlled, Clinical Trial of High-Dose Supplementation with Vitamins C and E and Beta Carotene for Age-Related Cataract and Vision Loss. Archives of Ophthalmology. 2001; 119(10):1417-1439.
- Krishnan T, Ravindran R, Murthy G et al. Prevalence of Early and Late Age-Related Macular Degeneration in India: The INDEYE Study. Investigative Opthalmology & Visual Science. 2010; 51(2):701-707.
- Okamoto H, Umeda S, Obazawa M et al. Complement factor H polymorphisms in Japanese population with age-related macular degeneration. Molecular Vision. 2006; 12:156–158.
- Kanda A, Chen W, Othman M et al. A variant of mitochondrial protein LOC387715/ARMS2, not HTRA1, is strongly associated with age-related macular degeneration. Proceedings of the National Academy of Sciences. 2007; 104(41):16227-16232.
- Baker P, Brown G. Stem-cell therapy in retinal disease. Current Opinion in Ophthalmology. 2009; 20(3):175-181.
- Machalińska A, Rogińska D, Pius-Sadowska E. Neuroprotective and Antiapoptotic Activity of Lineage-Negative Bone Marrow Cells after Intravitreal Injection in a Mouse Model of Acute Retinal Injury. Stem Cells International. 2015;2015:1-17
- Siqueira R, Voltarelli J, Messias A, Jorge R. Possible mechanisms of retinal function recovery with the use of cell therapy with bone marrow-derived stem cells. Arquivos Brasileiros de Oftalmologia. 2010; 73(5):474-479.
- Baglio S, Pegtel D, Baldini N. Mesenchymal stem cell secreted vesicles provide novel opportunities in (stem) cell-free therapy. Frontiers in Physiology. 2012; 3:359.
- Bertolotti E, Neri A, Camparini M, Macaluso C, Marigo V. Stem cells as source for retinal pigment epithelium transplantation. Progress in Retinal and Eye Research. 2014; 42:130-144.
- Schmitz-Valckenberg S, Fleckenstein M, Scholl H, Holz F G. Fundus Autofluorescence and Progression of Age-related Macular Degeneration. Survey of Ophthalmology. 2009; 54(1):96-117.
- Ruckmann AV, Fitzke FW, Bird AC. Fundus autofluorescence in age-related macular disease imaged with a laser scanning ophthalmoscope. Investigative ophthalmology and visual science. 1997; 38(2):478–486.
- Bearelly S, Chau F, Koreishi A, Stinnett S, Izatt J, Toth C. Spectral Domain Optical Coherence Tomography Imaging of Geographic Atrophy Margins. Ophthalmology. 2009; 116(9):1762-1769.
- Brar M, Kozak I, Cheng L et al. Correlation between Spectral-Domain Optical Coherence Tomography and Fundus Autofluorescence at the Margins of Geographic Atrophy. American Journal of Ophthalmology. 2009; 148(3):439-444.
- Yehoshua Z, Rosenfeld P, Gregori G, Penha F. Spectral Domain Optical Coherence Tomography Imaging of Dry Age-Related Macular Degeneration. Ophthalmic Surgery, Lasers, and Imaging. 2010; 41(6):S6-S14.
- Gerth C, Delahunt P, Alam S et al. Cone-Mediated Multifocal Electroretinogram in Age-Related Macular Degeneration. Archives of Ophthalmology. 2006; 124(3):345-352.
- Augustin A. Optical Coherence Tomography Imaging and Quantitative Assessment for Monitoring Dry Age-related Macular Degeneration. European Ophthalmic Review. 2012; 06(02):72-77.
- Marmor M, Holder G, Seeliger M, Yamamoto S. Standard for clinical electroretinography (2004 update). Documenta Ophthalmologica. 2004; 108(2):107-114.
- Siqueira R, Messias A, Voltarelli J, Scott I, Jorge R. Intravitreal Injection Of Autologous Bone Marrow–Derived Mononuclear Cells For Hereditary Retinal Dystrophy. Retina. 2011; 31(6):1207-1214.
- Park S, Caballero S, Bauer G et al. Long-Term Effects of Intravitreal Injection of GMP-Grade Bone-Marrow–Derived CD34+Cells in NOD-SCID Mice with Acute Ischemia-Reperfusion Injury. Investigative Opthalmology & Visual Science. 2012; 53(2):986-994.
- Calzi SL, Kent DL, Chang K-H et al. labeling of stem cells with monocrystalline iron oxide for tracking and localization by magnetic resonance imaging. Microvasc Res. 2009; 78(1):132–139.
- Otani A, Dorrell M, Kinder K et al. Rescue of retinal degeneration by intravitreally injected adult bone marrow–derived lineage-negative hematopoietic stem cells. Journal of Clinical Investigation. 2004; 114(6):765-774.
- Tomita M, Adachi Y, Yamada H et al. Bone Marrow-Derived Stem Cells Can Differentiate into Retinal Cells in Injured Rat Retina. Stem Cells. 2002; 20(4):279-283.
- Jonas J, Witzens-Harig M, Arseniev L, Ho A. Intravitreal autologous bone marrow-derived mononuclear cell transplantation: a feasibility report. Acta Ophthalmologica. 2008; 86(2):225-226.
- Park SS, Bauer G, Panorgias A et al. Intravitreal Autologous Bone Marrow CD34+ Stem Cell Therapy for Macular Degenerative Disease–A Pilot Clinical Trial. Investigative ophthalmology and visual science. 2014; 55(13):2995.
- Kumar A, Mohan Raj S, Basavaraj Mochi T, Mohanty S, Seth T, Azad R. Assessment of Central Retinal Function after Autologous Bone Marrow Derived Intravitreal Stem Cells Injection in Patients with Retinitis Pigmentosa using Multifocal ERG: A Pilot Study. World Journal of Retina & Vitreous. 2012; 2:5-13.
- Song W, Park K, Kim H et al. Treatment of Macular Degeneration Using Embryonic Stem Cell-Derived Retinal Pigment Epithelium: Preliminary Results in Asian Patients. Stem Cell Reports. 2015; 4(5):860-872.
Tables
Table 1 Best corrected visual acuity – case and controls
| Pre-injection | 1 month | 3 months | 6 months | 9 months | P value | |
| Case | 1.24 ±0.28 | 1.24 ±0.35 | 1.16 ±0.42 | 1.12 ±0.40 | 1.11 ±0.41 | 0.07 |
| Control | 1.15 ±0.39 | 1.16 ±0.39 | 1.17 ±0.37 | 1.21 ±0.31 | 1.24 ±0.36 | 0.23 |
| Mean values (log MAR) ± Standard deviation | ||||||
Table 2 Sub-RPE illumination – case and controls
| Pre-injection | 1 month | 3 months | 6 months | 9 months | P value | |
| Case | 7.6±4.6 | 6.55±4.12 | 5.48±3.61 | 5.07±3.39 | 4.98±3.2 | 0.002 |
| Control | 7.95±3.95 | 8.3±4.02 | 8.4±4.09 | 8.74±4.1 | 9.15±4.06 | 0.009 |
| Mean values (mm2 ) ± Standard deviation | ||||||
Table 3: mf ERG amplitude (mean values in nv/deg2) – case and controls
| Ring | Group | Pre procedure | 1 month | 3 months | 6 months | 9 months | P value |
| <20 | Case | 500.85 | 366.12 | 493.16 | 583.43 | 586.98 | 0.03 |
| Control | 541.64 | 409.96 | 537.07 | 525.8 | 527.68 | 0.728 | |
| 2-50 | Case | 375.18 | 266.66 | 400.17 | 416.18 | 421.66 | 0.82 |
| Control | 425.91 | 299.04 | 346.3 | 349.44 | 330.1 | 0.008 | |
| 5-100 | Case | 311.19 | 336 | 399.82 | 435.9 | 454.8 | 0.001 |
| Control | 385.78 | 376.51 | 380.15 | 333.19 | 298.26 | 0.03 | |
| 10-150 | Case | 428.23 | 425.08 | 406.78 | 392.86 | 394.18 | 0.96 |
| Control | 382.95 | 340.14 | 351.4 | 305.79 | 313.99 | 0.20 | |
| >150 | Case | 399.81 | 335.06 | 405.66 | 425.39 | 411.78 | 0.09 |
| Control | 428.01 | 372.43 | 388.88 | 372.38 | 379.03 | 0.33 |
Table 4: mf ERG implicit time (mean values in msec) – case and controls
| Ring | Group | Pre procedure | 1 month | 3 months | 6 months | 9 months | P value |
| <20 | Case | 48.06 | 53.65 | 41.83 | 42.5 | 42.7 | 0.013 |
| Control | 49.61 | 51.27 | 43.72 | 42.43 | 43.46 | 0.016 | |
| 2-50 | Case | 46.38 | 46.06 | 42.99 | 42.56 | 42.51 | 0.12 |
| Control | 48.6 | 49.37 | 46.53 | 50.18 | 51.72 | 0.16 | |
| 5-100 | Case | 51.85 | 52.62 | 48.05 | 51.25 | 50.74 | 0.56 |
| Control | 51.66 | 50.77 | 51.13 | 53.14 | 51.27 | 0.69 | |
| 10-150 | Case | 49.8 | 55.64 | 46.96 | 50.92 | 48.9 | 0.58 |
| Control | 49.39 | 54.26 | 47.47 | 49 | 49.34 | 0.72 | |
| >150 | Case | 48.34 | 46.86 | 44.57 | 43.67 | 43.98 | 0.001 |
| Control | 45.84 | 44.41 | 44.06 | 44.85 | 43.78 | 0.19 |
Table 5: change in greatest linear dimension of geographic atrophy – case and controls
| Pre injection | 1 month | 3 months | 6 months | 9 months | P value | |
| Case | 5.39 | 5.40 | 5.33 | 5.18 | 5.17 | <0.001 |
| Control | 5.06 | 5.16 | 5.28 | 5.41 | 5.35 | 0.009 |
| Greatest linear dimension (mm) | ||||||
Figure legends:
Figure 1 Representative Light Microscope Image of Giemsa-stained MNCs (left) a. 10x magnification image (middle) b. 40x magnification image (right) c. 100x magnification image

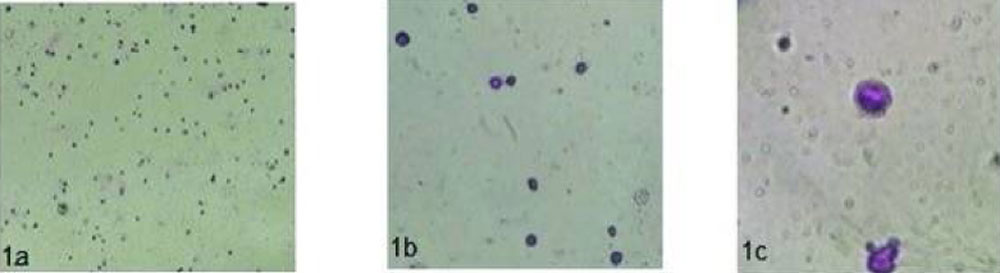
Figure 2Representative plot for CD34 enumeration. Quantification of MNCs by flow cytometry. Cell distribution based on FSC (forward scatters) and SSC (side scatter) parameter that describe their size and granularity

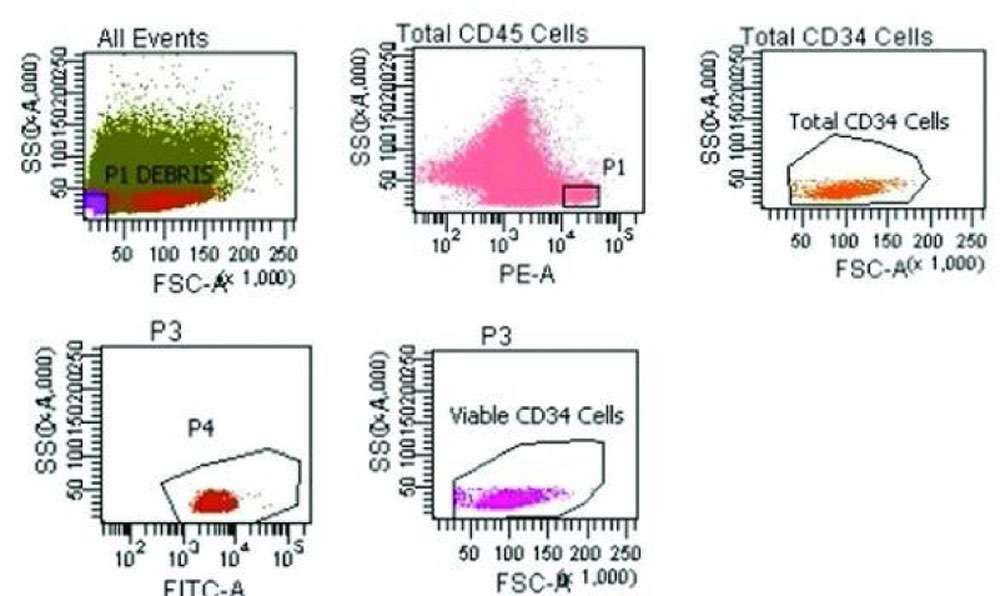
Figure 3a Change in Sub-RPE illumination in control on two consecutive visits

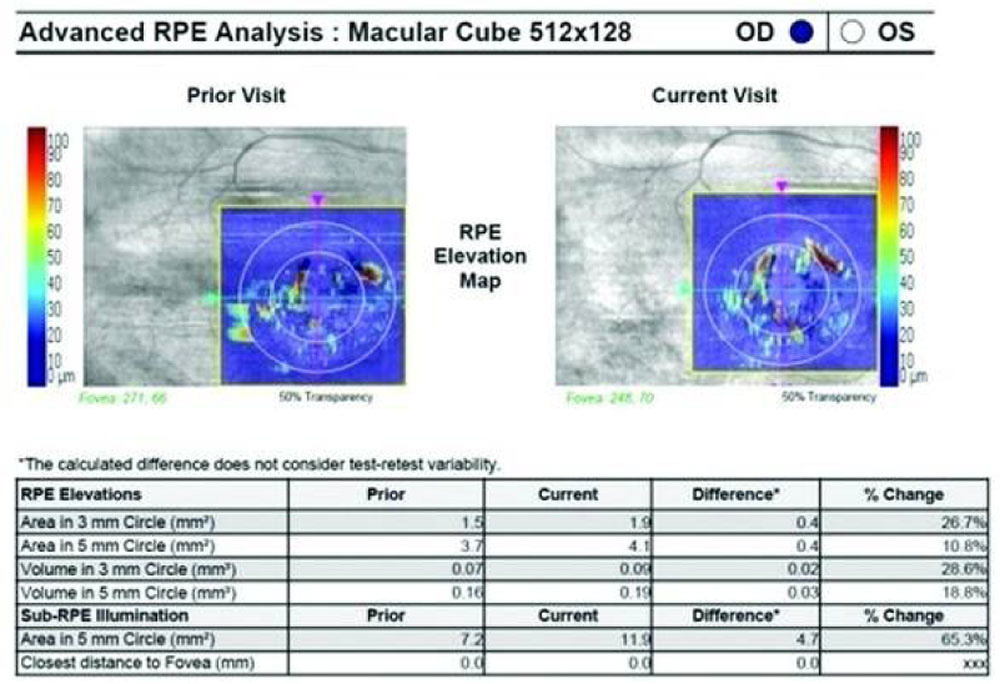
Figure 3b Change in Sub-RPE illumination in case on two consecutive visits

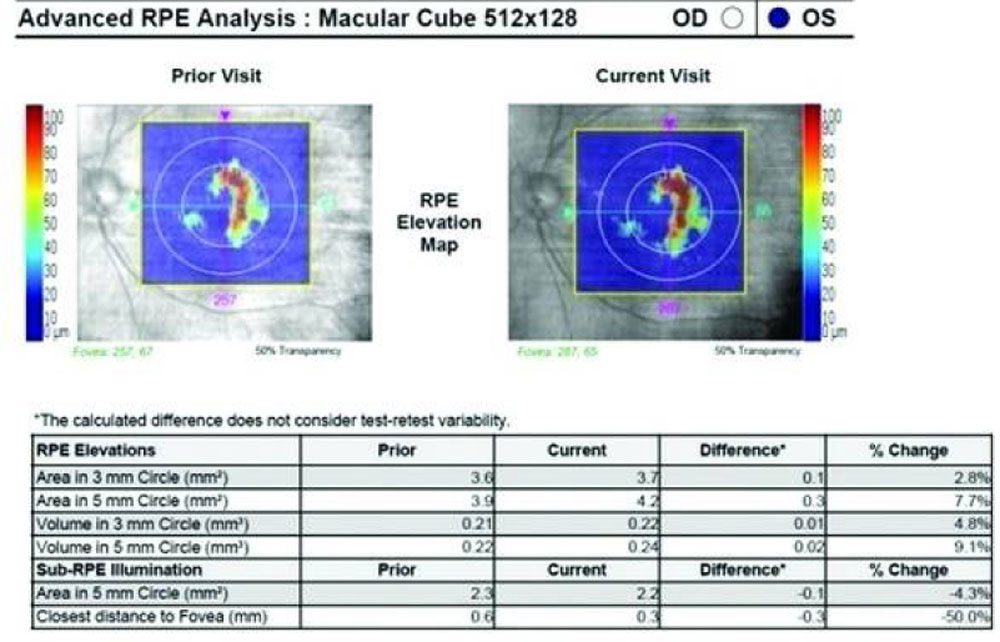
Figure 4 Change in greatest linear dimension of geographic atrophy – case and control. (a) greatest linear dimension of a case prior to intervention. (b) greatest linear dimension of same case 6 months post intervention. (c) greatest linear dimension of a control prior to intervention. (d) greatest linear dimension of same control on 6 months follow up.

Leave a Comment