
Dr. L Sophia, L17229, Dr. Sujata S
Abstract:
Purpose: To evaluate an association between body mass index (BMI) and intraocular pressure (IOP) in men and women.
Materials and methods: An observational study of 200 consecutive out-patients (90 males, 110 females aged 30-80 years), presenting at a tertiary eye hospital in southern India.
Results: Ninety-four (47 %) of the 200 participants had a normal BMI, 67 (33.5%) were overweight and 33 (16.5 %) were obese. Of the 33 obese participants, 19 (57.6 %) were females. The mean BMI was 25.06 ± 4.66 and the mean IOP was 15.78 ± 3.99 mmHg. There was a positive, statistically significant, correlation between BMI and IOP (r = 0.2013, P = 0.004).
Conclusion: Obesity is possibly an independent risk factor for increasing IOP in both men and women, with an increase in BMI being positively associated with increase in IOP. This is important in view of the current obesity epidemic.
Keywords: Body mass index, intra ocular pressure, eye
- Introduction
Obesity in India has reached epidemic proportions in the 21st century, with morbid obesity affecting 5% of the country’spopulation.[1] Obesity in India more than doubled in children and tripled in adults between 1980 and 2015. [2]Internationally, a Body Mass Index (BMI) over 25 kg/m2 isconsidered to be overweight, whereas a BMI of >30 kg/m 2 is considered obese.Since being overweight and obesity have become global epidemics,[3]the question arises whether there is a relationship between obesity and elevated intraocular pressure (IOP). A number of studies have attempted to identify the risk factors associated with development of elevated IOP. Several studies in western populations, have suggested that age is related positively with IOP.[4] Moreover, some epidemiological studies have examined a possible relationship between BMI and IOP;[5]these studies suggest that high BMI is an independent risk factor for elevated IOP when considered with age and hypertension.
The current study aimed to evaluate a possible association between BMI and IOP in men and women.
- Materials and methods
This was an observational study on 200 consecutive out-patients presenting at a tertiary eye hospital in southern India, over a period of 3 weeks in November 2016.The Institutional Ethics Committee approved the conduct of the study and all subjects who participated providedwilful verbal consent.
2.1 Inclusion criteria included the following: age between 30 – 80 years; either gender; IOP <30 mm Hg. Individuals were excluded if even one of the following exclusion criteria was present: IOP > 30 mm Hg in either eye; a difference in IOP between the eyes exceeding 2 mmHg; presence of glaucoma, corneal pathologies or endocrine disorders.
2.2 Based on these criteria, 200consecutive patients, (90 males and 110 females, ranging in age from30-70 years), were enrolled. All patients underwent a complete ophthalmological examination including visual assessment by Snellen’s chart, IOP measurement by noncontact tonometer, optical pachymetry to determine central corneal thickness (a corneal thickness of 540 µm was taken as normal and pressures were adjusted accordingly), and slit lamp examination of the anterior segment and the posterior segment using a +90 Dioptre lens. In addition, the weight (kilograms) and height (meters) were also measured. BMI was calculated based on the formula:
BMI = Weight in kilograms / Height in square metres
2.3 Based on the calculated BMI (kg/m2)values, the enrolled individuals were categorised as underweight if BMI was less than 18.5, as normal if BMI was 18.5 to 24.9, as overweight if BMI was 25 to 29, and as obese if BMI was > 30 kg/m2.
2.4 The data obtained were subjected to statistical analysis using Chi square test and Pearson’s correlation coefficient. A P value <0.05 was considered to be statistically significant.
- Results
A total of 200 subjects were screened. There were 90 males (45 %) and 110 females (55%).The mean age of the participants was 50.32 ± 11.31 (range 30-70) years. The mean age (years) in females (50.77 ± 9.97) was higher when compared to males (49.88 ± 11.28).
3.1 IOP
The mean IOP (mmHg) was 15.78 ± 3.99 (95% CI 15.22-16.33). The mean IOP(mmHg) in females (15.92 ± 4.05) was found to be higher than that in males (15.01±3.84).The mean IOP (mmHg) in subjects with normal BMI (18- 24.9 Kg/M2) was 15.2 (95%CI 14.43 to 15.96), but was found to be higher, that is 15.48(95% CI14.26 to 16.69) and 17.3 (95%CI 15.67 to 18.92) for BMI categories 25-29 and > 30 Kg/M2respectively.
3.2 BMI
Applying the WHO guidelines to calculate the BMI, we found that 94 (47 %) of the 200 participants had a normal BMI, 67 (33.5%) were overweight and 33 (16.5 %) were obese. Of the 33 obese participants, 19 (57.6 %) were females.The mean BMI was 25.06 ± 4.66(95%CI 24.41- 25.705) Kg/M2. The mean BMI in males was 24.6 ± 4.64 Kg/m2,whereas in females, the mean BMI was25.5 ± 5.02 Kg/m2.
3.3 BMI and age
In the current study, 54 (57.4%) of 94 individuals aged ≤50 years had a BMI <24.9 kg/m2, whereas 46 (43.4%) of 106 individuals aged >50 years had a BMI< 24.9 kg/m2 (Table1).This difference was of borderline statistical significance (Yates’ Chi-square=7.752, {degree of freedom [d.f.] =3}; P = 0.05). Also, we found that there was a statistically significant, positive correlation between age and BMI (r = 0.1815, P = 0.01) (Figure 1)
3.4 BMI and gender
In the current study, 94 had a normal BMI; 58 % of these were females and 42% were males. Of the 100 individuals who had a BMI > 25, 47 % were males and 53 % were females. This difference was not statistically significant (Chi square = 2.1844 {d.f =3}, p = 0.54) (Table 2)
3.5 BMI and IOP
The mean IOP of all subjects was 15.78 ± 3.99 mm Hg. Twenty subjects (10 %) had an IOP > 21mmHg. Ninety five (95)% of those with a normal BMI, 91% of overweight and 81 % of obese had an IOP < 21 mm Hg.
Of 29 individuals who had a BMI ≤ 20 kg/m2, 23(79.3 %) had an IOP < 21 mmHg; of 171 individuals who had a BMI > 20 kg/m2, 157 (91.8%) had an IOP <21 mmHg; this difference was not statistically significant (Yates’ chi square = 3.029{d.f. =1}; P = 0.082) (Table 3)
Correlation of BMI and IOP:
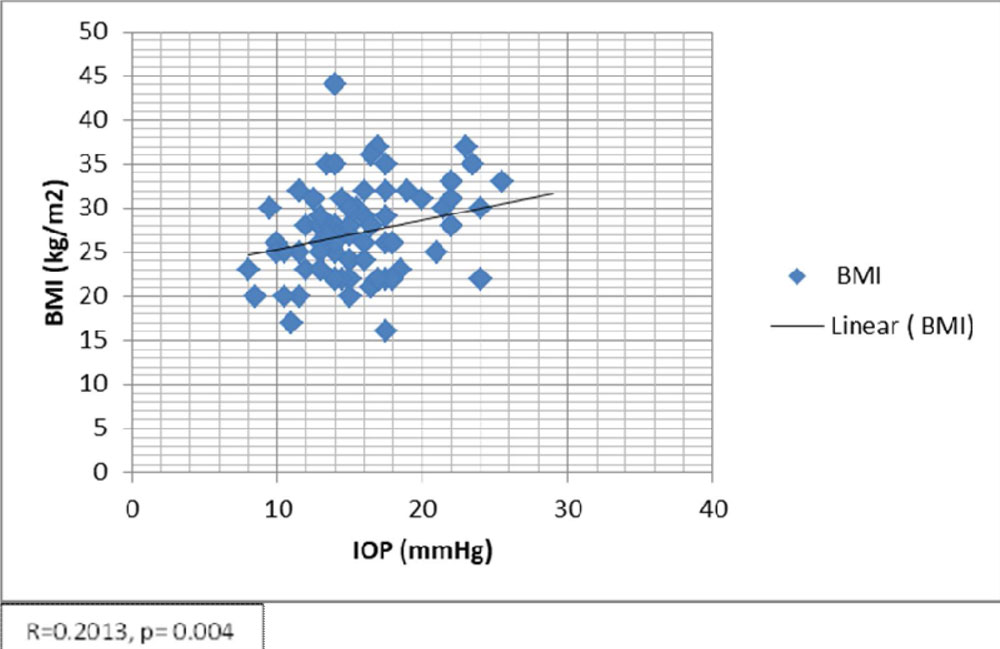
There was a positive, statistically significant, correlation between BMI and IOP (r = 0.2013, P = 0.004)(Figure 2).When such a correlation (between BMI and IOP) was analysed in males and females separately, we found that, there was a positive correlation between BMI and IOP, in both sexes (R = 0.0914 in males, R = 0.2798 in females), however, it was of statistical significance only in females (p = 0.004) and not so in males (p= 0.368)
BMI and Comorbidities
Of the 200 participants, we found that 70 subjects (35%) had one or more comorbid conditions such as diabetes, hypertension, ischemic heart disease, with 54 % ( n=38/70) of these individuals having a BMI > 25 Kg / m2
Discussion:
This observational study, conducted over a period of 3 weeks, at a tertiary care hospital,evaluated the IOP in men and women with respect to their BMI levels. Overall, women were found to have ahigher IOP than men, a finding consistent with that reported in some previous studies. [6]Other studies, however, have found men to have a higher average IOP compared with women.[7]
Interestingly, in our study, 53(48.2%) of 110 females had a BMI of 25kg/m2 or greater, compared to 47 (52.2%) of 90 males.The mean BMI in our study was 25.06 Kg/m2. According to the current definition for Obesity in the Asia-Pacific region, adults are considered to be overweight at BMI >23 and obese at BMI > 25. [8]We have used BMI values of >25 and >30 respectively to define overweight and obesity in our population.BMI was found to be positively correlated to IOP in this study. A positive linear correlation between BMI and IOP was found in both men and women. When the IOP in subjects with normal weight (BMI<25 kg/m2) was compared to the IOP in subjects with increased BMI, that is, subcategories 25 to 29 and >30kg/m2, the IOP was higher depending on the BMI subcategory. Similar results were seen in a study by Cohen et al,[7]wherein the authors found a significant gradual increase in IOP for each increase in BMI subcategory. These changes remained significant after regressing for common reasons for increased IOP,that is age, and prevalence of hypertension and diabetes mellitus.
In the current study, it was also seen that the greater the age, the higher the BMI, especially in individuals above 50 yearsof age. Gordon et al,[9]found that, with aging, the increased BMI was noted until 60 years of age after which it showed a tendency to decrease.
We can therefore infer that a greater age and higher BMI may be reflected in a higher IOP.These findings clearly show obesity to be a possible risk factor for increased IOP. The consistent elevation across the whole study group in both sexes, and the increased likelihood of abnormally elevated IOP in the higher BMI group, may add to other risk factors more prevalent in obese individuals for increased IOP.
Although there appeared to be a small increase in IOP in relation to BMI in the current study, subjects with abnormal BMI, were found to have higher incidence of IOP > 21mm Hg. It must also be remembered that glaucoma can occur in subjects with normal IOP, and it may not develop in some subjects with increased IOP.[10]Hence we cannot assume a correlation between BMI and glaucoma. Gasser et al,[11]evaluated the direct effect of BMI on glaucoma and could not show such association. In a study by Flammeret al,[12]it was emphasized that the element of vascular dysregulation rather than vascular atherosclerosis, in which BMI is a cofactor, was the major risk factor for glaucoma. Vascular dysregulation may lead to local vasospasms and disturbed autoregulation of blood flow in the optic nerve head, choroid, and other ocular tissues. This pathophysiologic pathway may explain why BMI will increase IOP but not necessarily increase glaucoma risk.
In the current study, 35% of the subjects were found to have other systemic comorbidities, such as diabetes mellitus, hypertension, ischemic heart disease, out of which, 54 % were either overweight or obese. Hypertensionand diabetes mellitus are very common in obese patients and are established risk factors for increased IOP.[13]This may explain the incidence of increased IOP in obese individuals. There are possible suggested direct effects of obesity which can cause increase in IOP. It has been suggested that increased orbital pressure due to excess orbital fat may increase episcleral venous pressure and result in a decrease in outflow facility. Alternatively, the deposition of lipids has been suggested to reduce outflow facility for aqueous thereby resulting in higher IOP in obese subjects.[14]
Conclusion:
- In both men and women, higher BMI is positively correlated with higher IOP, with obesity being a possible risk factor for high IOP
- Changing lifestyles, unhealthy eating practices and increased lifespan may possibly contribute to elevated BMIs in young and old
- Abnormal BMI associated with ageing, hypertension and diabetes, can compound this phenomenon.
- Normal IOP ranges according to BMI may need to be defined frompopulation based studies.
- Obesity maybe included as one among other risk factors, in a patient being assessed for glaucoma.
References:
- https://hindu.com./2007/10/12/stories/2007101260940600.htm- accessed on 25/9/2017
- 2.www.hindustantimes.com/…obesity…/story-aGkRFiY9FAQXgOJdfQYUCL.html- accessed 25/9/2017
- 3.James PT, Leach R, Kalamara E, et al. The worldwide obesity epidemic.Obes Res. 2001; 9(suppl 4):228S–233S
- 4.Nomura H, Shimokata H, Ando F, Miyake Y, Kuzuya F. Age-related changes in intraocular pressure in a large Japanese population: a cross-sectional and longitudinal study. Ophthalmology 1999; 106:2016-22
- Mori K, Ando F, Nomura H, et al. Relationship between intraocular pressure and obesity in Japan. IntJ Epidemiol. 2000; 29: 661–666
- Qureshi IA. Intraocular pressure: a comparative analysis between two sexes. ClinPhysiol 1997; 7: 247-55)
- Cohen E, Kramer M,Shochat T, Goldberg E, Garty M, Krause I . J Glaucoma 2016; 25: e509–e513
- Appropriate body-mass index for Asian populations and its implications for policy and intervention strategies. THE LANCET • Vol 363 • January 10, 2004 • www.thelancet.com
- Gordon MO, Beiser JA, Brandt JD. The ocular hypertension treatment study baseline factors that predict the onset of primary open angle glaucoma. Arch Ophthalmol 2002; 120: 714-20
- Heijl A, Leske MC, Bengtsson B, et al. Reduction of intraocular pressure and glaucoma progression: results from the Early Manifest Glaucoma Trial. Arch Ophthalmol. 2002; 120:1268–1279
- Gasser P, Stumpfig D, Schotzau A, Body mass index in glaucoma. J Glaucoma. 1999; 8:8–11
- Flammer J, Orgul S. Optic nerve blood-flow abnormalities in glaucoma. ProgRetin Eye Res. 1998; 17:267–289
- Wu SY, Leske MC. Associations with intraocular pressure in the Barbados Eye Study. Arch Ophthalmol. 1997; 115: 1572–1576
- Bulpitt CJ, Hodes C, Everitt MG. Intraocular pressure and systemic blood pressure in the elderly. Br J Ophthalmol. 1975; 59:717–720
Figure legends:
Figure 1:Scatter plot showing a putative correlation between body mass index (kg/m2) and age (years) in study individuals
Figure 2:Scatter plot showing a putative correlation between body mass index (kg/m2) and intraocular pressure (mm Hg) in the study individuals
Table 1: Age distribution of study individuals in relation to subcategories of body mass index (BMI)
| BMI (kg/m2) | Age ≤ 50 yrs (n) | Age >50 yrs (n) | Total (n) |
| <18.5 | 3 | 3 | 6 |
| 18.5 – 24.9 | 51 | 43 | 94 |
| 25-29 | 32 | 35 | 67 |
| >30 | 8 | 25 | 33 |
| 94 | 106 | 200 |
(Yates’ Chi-square = 7.752, {degree of freedom [d.f.] =3}; P = 0.05)
Table 2: Gender distribution of study individuals in relation to subcategories of body mass index
| BMI kg/m 2 | Males (n) | Females(n) | Total (n) |
| < 18.5 | 4 | 2 | 6 |
| 18.5 – 24.9 | 39 | 55 | 94 |
| 25-29 | 33 | 34 | 67 |
| >30 | 14 | 19 | 33 |
| 90 | 110 | 200 |
Chi square = 2.1844 {d.f. = 3}, p=0.54
Table 3: Intraocular pressure in study individuals in relation to body mass index
| BMI (kg/m2) | IOP <21mmHg
(n) |
IOP ≥ 21mmHg
(n) |
Total
(n) |
| ≤ 20 | 23 | 6 | 29 |
| >20 | 157 | 14 | 171 |
| 180 | 20 | 200 |
(Yates’ chi square = 3.029 {d.f. =1}; P = 0.082)
Figure 1: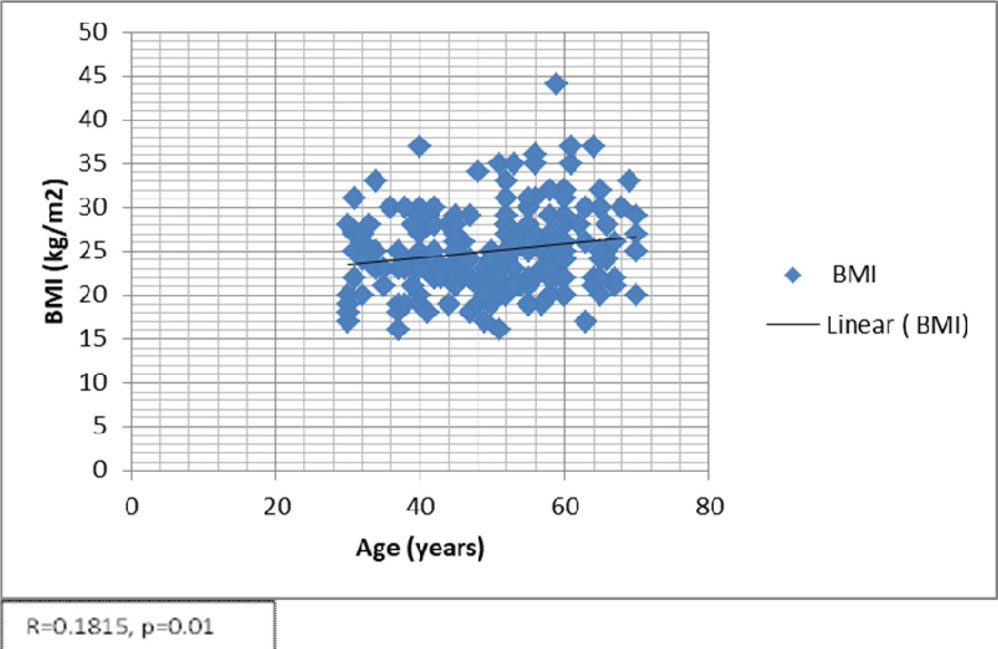
Figure 2:
Leave a Comment