
Dr. Mihir Trilok Kothari, K08617, Dr.
Rutika Dodeja
Abstract:
Purpose: To quantitatively assess intra-observer variation in visual acuity (VA) measurements on different types of charts, with the induction of optical and media blur.
Design: Evaluation of diagnostic tests.
Subjects: Two adult subjects with best-corrected visual acuity better than -0.1 logMAR (20/16 Snellen).
Methods: VA was tested on four charts: Snellen Vision Box, projector (ETDRS), space saving (Snellen chart using logMAR steps)and LCD(ETDRS).This study has three parts: (1) comparing VA measurements at different working distances(2) inducing optical blur using +1D, +2D, and +3D spherical and cylindrical powered lenses and (3) creating media blur using graded (0.8, 0.6, 0.3, and 0.1 logMAR) Bangerter foils. Testing simulated a typical clinical assessment of VA and was done over four days (one chart daily).
Main OutcomeMeasures: VA was measured in each part of this study for both observers. Variation in VA at each increment of optical and non-optical blur,and variation in the number of lines of VA lost between increments were calculated(in logMAR).Variation of two lines of VA (logMAR)or more was clinically significant.
Author Affiliations:
[1]Jyotirmay Eye Clinic and Ocular Motility Laboratory, 104/105 Kalika Tower, Kolbad Road, Opp. Pratap Cinema, Thane West, Maharashtra400601, India
[1]The Johns Hopkins University, 3400 N. Charles St., Baltimore, MD 21218, USA
Results:Working distance does not significantly impact VA. At most increments of optical blur, there was clinically significant variation; variationin logMARranged from 0.07 to 0.54 for Observer 1and 0.12 to 0.53 for Observer 2. Inter-chart variation between increments in logMAR lineswas 2.02 to 6.06 for Observer 1, and 2.68 to 4.37 for Observer 2. VA at increments of media blur was similar across charts; inter-chart variation in logMARranged from 0.08 to 0.28 for Observer 1 and 0.06 to 0.26 for Observer 2.There was some significant inter-chart variation between increments of media blur inlogMARlines; ranges were 1.80 to 3.01 for Observer 1, and 1.02 to 2.71 for Observer 2.
Conclusions:Intra-observer variation inVAwith optical blur across charts is clinically significant. However, a similar loss of VA occurs with media blur across charts, though the variation in number of lines lost incrementally may be significant. These findings indicate a need to standardize practices in communicating and interpreting data in scientific literature.
Introduction
Visual acuity (VA) is a basic andcrucialmeasurement for the diagnosis and management of ocular conditions and diseases as well as an important parameter reported ubiquitously, but practices to find VA vary significantly. Studieshave reported a lack of standardizationin the method of measurement of VA and related factors in publications across major journals that makes these measurements difficult to compare.1,2Yet, we found that none have previously considered and quantitatively assessed intra-observervariation due todifferent vision testing charts commonly employedto measure VA.
Although logMAR charts adhering to the Bailey-Lovie design, specifically the Early Treatment of DiabeticRetinopathy Study (ETDRS) chart have been widely accepted as the gold standardfor VA measurement, there exist multiple variants of charts designed for different settings, distances, affordability etc. which have inherent differences.3,4Many optometrists and ophthalmologists around the world continue to employ alternative charts, such as the Snellen chart,whichvarious studies have evaluated and deemed unstandardized and less reliable than ETDRS, and more generally, logMAR charts.2,3,18,19
In this study, we formally investigatewhether there is intra-observer variability in VA measurement and in the number of lines of VAlost with the induction of optical and non-optical blur across various charts.
Materials and Methods
Subjects
In this prospective observational study, two observershad their VA tested on four different charts. Observer 1 was a 19-year-old male with no significant refractive error; he had +0.25D cylindrical power in both eyes. Observer 2 was a 28-year-old myopic female with -4D spherical power in her right eye and -4.25D in her left eye, corrected with appropriately powered contact lenses.
Procedures
[TABLE 1]
The four charts employed for testing were theSnellenVision Box, Nidek Space Saving Chart SSC-370, Nidek Projector Chart CP-690, and AppasamyiChart LITE (LCD). Critical information about each chart based upon the recommendations of Williams et al.is presented in Table 1.2All testing rooms were dimly-lit (measured using a lux meter and quantified in Table 1). Subject’s postureswere upright, headswere kept straight,and they both used their dominant eye(right eye) for all testing. Subject’s best-corrected visual acuity (BCVA)wasmeasured on all charts, which we define as an individual’s highest VA with full correction of significant refractive errors based on the guidelines prescribed by the American Academy of Ophthalmology.5VA testing began with finding BCVA starting at the 0.04 logMAR line on the charts and continued until the subject either read all the lines available on the chart ( past 0.0 logMAR) or was unable to readat least half theoptotypes on the next line. Then, lenses of increasing powerwere introduced,first spherical power and later cylindrical powerand the VA line presented to the observer was decreased (towards lower VA) until the subject was able to read all the optotypes in that line. From there, the VA line presented was increased (towards higher VA) until the observer could not identify more than half theoptotypes. This method of starting at high VA lines and decreasing the VA lineserves to reduce subjects’ bias by minimizing the number of times asubject reads the same line (and unintentionally memorizesit). This process was facilitated by a highly experienced pediatric optometrist.
Subjects only attempted the VA test once, to replicate a typical clinical assessment.To minimize any bias, we asked the observer to objectively stateany uncertainty while reading the optotypes.If they expressed that the optotype was unclear and there was reason for doubt (e.g. if they suggested an optotype could be one of two letters and could not commit to one), the optotype was not counted in the VA measurement. We have indicated an uncertainty of one optotype (0.02 logMAR) for all VA measurements.
Our investigation consists of three parts. First, we assessed whether any differences in VA can be attributed to variation in subject-chart distance. For this, we used the Nidek Projector Chart CP-690 and measured VA at the original working distance (9ft) and at half the distance (4.5ft) for both spherical and cylindrical powers. To account for working distance, we calculated the working lens required using the equation: .At a distance of 4.5ft, the subject required +0.40D of spherical power to compensate for the working distance; we employed+0.37D spherical power. As shown in table 1, we calculated the required working lens for the measured working distances for each of the other charts, though they were found to be negligible.
Next, we measured and compared VA as well as the incremental loss of lines of VA by creating optical blur using +1D, +2D, and +3D spherical lenses and equivalent cylinders. We chosenot toemploy minus-powered lenses as accommodationwould interfere with our ability to observe a loss in VA.The tests with spherical and cylindrical lenseswere performed consecutively, though subjects were given five minutes to relax their eyes in between. Testing was carried out over a period of four days, with only one chart per day to avoid causing excess strain and headache.
Finally, we similarly employednon-optical (media) blur to discern the amount of variation inVA loss from simulated non-refractive ocular diseases, such as cataract, on the different VA charts.We employed a Bangerter Occlusion Foil Bar (Western Ophthalmics) to create media blur (of 0.8, 0.6, 0.3 and 0.1 logMAR).
Data Processing
In order to compare the charts, we considered each observer’s VA at each increment of
optical/non-optical blur as well asthe incremental differences. All values were converted to logMAR, as outlined below.
The projector and space saving charts were given on the chart in decimal form, the Snellen chart displayed VA in Snellenfractions, and the LCD chart presented it inlogMAR. In order to compare the data from each of the different charts, we converted all measurements to logMAR, using the equation21: .
The LCD chart displayed seven lines with five letters each.For incompletely read lines, VA was calculated by adding the constant character value of 0.02 logMAR for each of the characters read on that line to the VA of the previous line.10However, on all other charts, the number of characters per line varied. It would have been erroneous to assign a constant value to each character as on the LCD chart.21Hence, a closer value was calculatedfor each character by taking the difference in VA between two lines and dividing it by the number of characters available on that particular line. (Since fractions were given on the Snellen chart, VA was first converted to decimal form and then these ‘character values’were calculated to compute the decimal VA.) These character valuesallowed for a more precise approximation of VA. All decimal valueswere then converted to logMAR for comparison and analysis.
After obtaining the data in logMAR, the amount of VA loss that occurs between each diopter of optical blur was derived, and then translated into the number of lines of VA lost. 0.1 logMAR represents one line, so the number of lines lost was found by simply multiplying the loss in VA by 10. We did not consider the cumulative loss of lines (from BCVA to the specified optical or media blur) due to the variation in BCVA, which we established as somewhat invalid due to limitations of the charts themselves. Both observers’ BCVA was limited by the smallest available line,specifically on the LCD chart and SnellenVision Box (which ended at -0.08 logMAR and -0.18 logMAR, respectively). We took this into account when comparing the lines lost, as a lower measured BCVA (due to a chart’s lack of higher VA lines)creates an impression that there is less VA lost with the addition of +1D powered lens.
Given the focus of this study, we are concerned with clinical significance of our results. For all patients, we hold a difference of two lines on the logMAR chart (0.2 logMAR) as a clinically significant difference in VA.11,12
Results
Relationship between distance and change in VA
We found that at 9.0ftand 4.5ft on the Nidek Projector Chart, with +0.37D working lens(for 4.5ft testing distance), there was no clinically significant differencefor spherical and cylindrical power as shown on Figure 1. The data also indicate that the amount of VAloss varies between observers, though this has been reported and isgenerally irrelevantto our discussion.8
[FIGURE 1]
Loss of Lines of VAAcross Charts with Optical Blur
[FIGURE 2]
Figure 2 shows that there isgreat variation in the total loss of VA at all increments of optical blur. For both observers, both for spherical and cylindrical power, the loss of lines of VAappears to be least on the LCD chart, and greatest on the Snellen chart. The projector and space saving charts produce comparatively similar loss in VA. Table 2 quantifies the inter-chart variability in VA at each diopter for both observers, showing that at several increments there appear to be clinically significant differences between the charts.
[TABLE 2]
[TABLE 3]
The data in Table 3, for the loss of lines of VA between increments, show that between all increments, for both observers, there is clinically significant variation between the charts.The validity of the loss of lines between BCVAand+1D for both spherical and cylindrical power, however, is low due to limitations in the measurement of BCVA. For both other increments (+1D to +2D, and +2D to +3D spherical and cylindrical power), however, the data for amount of loss and variation arevalid.
Loss of Lines of VAAcross Charts with Media Blur
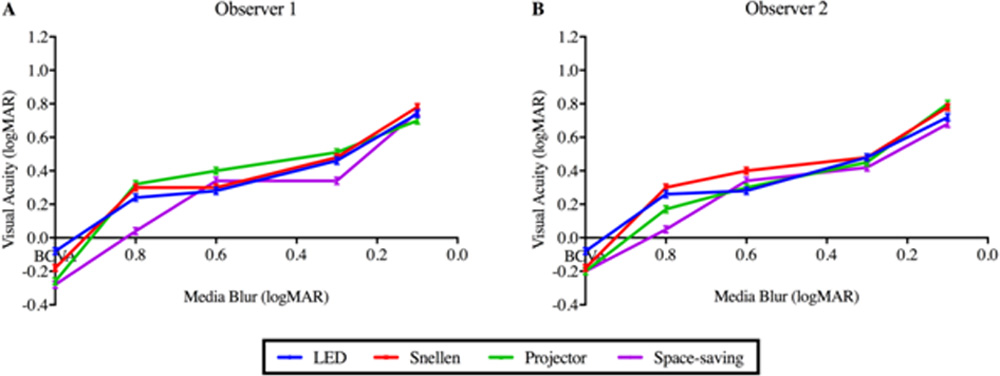
[FIGURE 3]
As depicted in Figure 3, unlike in the case of optical blur, it was found that the VA and loss of lines of VAbetween increments on each of the charts was similar across the media blurs (0.6, 0.3, and 0.1 logMAR), except for at 0.8 logMAR. Furthermore, the VA with each media blur was similar between observers.The data in Table 4show that there is little significant variation in the VA measured with different amounts of media blur. However, the incremental loss of lines of VA, shown in Table 5, can vary significantly. For Observer 1, the variation in 0.8 to 0.6 and 0.3 to 0.1logMAR is clinically significant, while only that between 0.8 to 0.6logMAR is for Observer 2.
[TABLE 4]
[TABLE 5]
Discussion
Our findings serve to suggest the following: (1) distance does not affect the loss in VA if all significant working factors are accounted for, signifying that the cause of the differences may be attributed to inherent differences in the charts (even those of the same technical type) (2) BCVA varies between charts and many charts cannot account for high VA which prevents detection of changes in high VA individuals (3) the loss of VA with spherical and cylindrical optical blur is disproportionate and highly variable across charts and between observers and (4) a generally similar loss of VA occurs with media blur across charts and between observers, though the number of lines of VAincrementallylost is highly variable.Ourdatapertaining to the effect of distance on VA measurement have been corroborated by multiple studies3,4,13; they conclude that distance is largely irrelevant to the measurement of VA (assuming the chart and subject are positioned as intended or working adjustments are made). No studies, however, have measured and demonstrated the differences that we observed between charts with optical and non-optical blur. The implications of these findings are immense in terms of our current practices communicating and interpreting data in scientific literature.
It has come to our attention that many ophthalmologists and optometrists only measure VA up to 0.0 logMAR in practice, which is the bar for normal healthy VA22; this, however,prevents the measurement and diagnosis of VAloss in individuals with superior VA (for instance, in Finland that is over 50% of the population).17 Such individuals may appear to be fine given their normal, or betterVA, but optimal vision varies for each individual.Practitioners who negligently measure onlyup to 0.0 logMARmay fail torecognize loss in VA and subsequently restore optimal VA in patients. Additionally, charts which only measure up to 0.0 logMAR or slightly greater VA may themselves limit a practitioner’s ability to provide proper care. For instance, in the case of Observer 1, as shown in Figure 2, there is virtually no VA loss seen on the LCD chart from BCVA to +1 power. This is inaccurate, however, since there is a clinically significant loss of VA as detected by the projector and space saving charts (which measure up to -0.3 logMAR). Thus, it is of importance that all practitioners employ charts which measure up to -0.3 logMAR, and measure past 0.0 logMAR to find each individual’s true BCVA.
Globally, visiting medical practitioners often employ different charts for testing patients depending on the facilities available to them at a particular location, which may impede proper patient care. In such cases, the practitioner ought to ensure thatpatients whether for regular check-ups or pre- and post-treatment, are checked using the same chart (and perhaps by necessity, the same location) consistently to ensure the validity of any observed differences. Using different charts may exaggerate or reduce any such observed differences in VA, which in turn can alter the prescribed course of treatment.Employing the same chart is necessary for patients with refractive error and macular degeneration, but this applies even for those suffering from glaucoma, cataract, and other diseases which cause non-optical blur given the incremental variation shown in Table 5.For instance, the spacesaving chart shows that the loss of lines between 0.8 and 0.6logMAR (for Observer 1 and 2) is significant, whereas all other charts indicate otherwise; treatment outcomes may vary depending on the patient response observed, based on the chart used. Charts need to be standardized as far as possible; we support the use of logMAR charts following the Bailey-Lovie design (preferably ETDRS). Snellen charts, though commonly used, have been established as inferior.18,19
Many researchers elucidate improvement in VA through a gain or loss of logMAR lines, which is a flawed method.2The evidence suggests thata change of a specific number of lines of VA on one chart does not necessarily correspond to the same number on another. In addition, VAloss varies between each diopter of optical blur (and media blur to some extent), which makes it all the more challenging to gauge the actual difference without sufficient context regarding the testing procedure and conditions, as well as the chart.A gain or loss of lines is insufficient to communicate the actual change in VA due to incremental variation; VA measurements pre- and post-treatment need to be indicated to provide meaningful insight.Finally, Kaiser describes the issues with assessing VA through lines lost when there are unequal optotypes per line of VA in Snellen charts, for instance.3
The conversion of VA measurements from one type of chart to another is erroneous, because not only are the measurements across charts inconsistent with one another, but the process of mathematical conversion is crude and varied.20,21However, some ophthalmology journals suggest displaying results in logMAR form; the methodology for VA conversions, however, is neither standardized nor usually well-explained when performed.2It is important for authors to clearly outline their methods for conversions so thatthe processed data is well understood and can be readily evaluated; additionally, if required,this will allow researchers to derive raw data from publications and reprocess themuniformlyfor comparison and discussion in meta-analyses, systematic reviews and other types of studies making use of published data. Providing contextand standardizing data presentation in this way is of great importance for practitioners and researchersto readily compare data and studies, make unbiased and well informed interpretations, and replicate results.Williams et al. have identified parameters which should to be includedfor satisfactory context, which have been included in this report (Table 1). We endorse their guidelines and recommend that they be rigorously followed.2
Finally, we would like to discuss some possible limitations to this study. First, subjects were only tested once, in order to replicate a clinical assessment. We deemed additional trials unnecessary, considering multiple studies have reported that subject retest variability is marginal; there is no statistically or clinically significant difference between retests of VA (even after one or more days).6-9Secondly, there were differences in the chart luminescence levels measured. Sheedy et al. found that the relationship between logMAR and the logarithm of chart luminance between 40 and 600 cd/m2 can be modeled by a straight line; doubling the chart luminance improves VA by 0.02 logMAR.23The chart luminance levels measured ranged between 75 and 130cd/m2 and thus any differences due to luminance would be less than 0.02 logMAR. The error bars of 0.02 logMAR on Figures 1, 2, and 3 account for this. Lastly, only two subjects were tested for the purposes of this study, as they were sufficient to suggest that there is clinically significant intra-person variation between charts.
This study serves as a primer for initiating serious discussion on the topic of visual acuity measurement and communication. As afundamental measurement, it is of the utmost importance that our methods for assessment are validated and standardized to allow for proper practice, and to boost the quality and validity of research in the field.
References
- Moutray TN, Williams MA, Jackson AJ. Change of visual acuity recording methods in clinical studies across the years. Ophthalmologica. 2008;222(3):173-7.
- Williams MA, Moutray TN, Jackson AJ. Uniformity of visual acuity measures in published studies. Invest. Vis. Sci.. 2008;49(10):4321-7.
- Kaiser PK. Prospective evaluation of visual acuity assessment: a comparison of snellen versus ETDRS charts in clinical practice (An AOS Thesis). Trans Am Ophthalmol Soc. 2009;107:311.
- Bryant K, Gay E, Hazell C, Harris S, Hollingsworth T, Moseley M, Shaw D, Fielder A. Visual acuity: a comparison of 3 and 6 metre test distances. Br Orthopt J. 1991;48:21-4.
- Refractive Errors & Refraction Surgery Preferred Practice Pattern – 2013. Ophthalmology. 2013.
- Beck RW, Moke PS, Turpin AH, Ferris FL, SanGiovanni JP, Johnson CA, Birch EE, Chandler DL, Cox TA, Blair RC, Kraker RT. A computerized method of visual acuity testing: adaptation of the early treatment of diabetic retinopathy study testing protocol. Am J Ophthalmol. 2003;135(2):194-205.
- Siderov J, Tiu AL. Variability of measurements of visual acuity in a large eye clinic. ActaOphthalmol Suppl. 1999;77(6):673-6.
- Brown B, Lovie-Kitchin JA. Repeated visual acuity measurement: establishing the patient’s own criterion for change. Optom Vis Sci. 1993;70(1):45-53.
- Bosch ME, Wall M. Visual acuity scored by the letter-by-letter or probit methods has lower retest variability than the line assignment method. Eye. 1997;11(3):411-7.
- Kitchin JE, Bailey I. Task complexity and visual acuity in senile macular degeneration. Aust J Optom. 1981;64(6):235-42.
- Fenwick EK, Man RE, Ong PG, Sabanayagam C, Gupta P, Cheng CY, Wong TY, Lamoureux EL. Association of Changes in Visual Acuity With Vision-Specific Functioning in the Singapore Malay Eye Study. JAMA Ophthalmol. 2016;134(11):1299-305.
- Chua B, Mitchell P. Consequences of amblyopia on education, occupation, and long term vision loss. Br J Ophthalmol. 2004;88(9):1119-21.
- Suckow M, Huffer S, Travison T, Khaw D, Johnson C, Lyons S, Quinn N, Ioussifova N, Moore B. Comparison of Visual Acuity at Multiple Test Distances Using the ETDRS Acuity Chart. Poster presented at: The American Academy of Optometry Annual Meeting; 2004; Hawaii.
- Polat U, Ma-Naim T, Belkin M, Sagi D. Improving vision in adult amblyopia by perceptual learning. ProcNatlAcadSci U S A. 2004;101(17):6692-7.
- Harley RD, Nelson LB, Olitsky SE, editors. Harley’s pediatric ophthalmology. Lippincott Williams & Wilkins; 2005.
- Rowe F. Visual fields via the visual pathway. Crc Press; 2016.
- Laitinen A, Koskinen S, Härkänen T, Reunanen A, Laatikainen L, Aromaa A. A nationwide population-based survey on visual acuity, near vision, and self-reported visual function in the adult population in Finland. Ophthalmology. 2005;112(12):2227-37.
- Hussain B, Saleh GM, Sivaprasad S, Hammond CJ. Changing from Snellen to LogMAR: debate or delay?.ClinExpOphthalmol. 2006;34(1):6-8.
- McGraw P, Winn B, Whitaker D. Reliability of the Snellen chart. BMJ. 1995;310(6993):1481.
- Ricci F, Cedrone C, Cerulli L. Standardized measurement of visual acuity. Ophthalmic Epidemiol. 1998;5(1):41-53.
- Holladay JT. Proper method for calculating average visual acuity. J Refract Surg. 1997;13(4):388-91.
- Xu L, Li J, Cui T, Hu A, Zheng Y, Li Y, Sun B, Ma B, Jonas JB. Visual acuity in northern China in an urban and rural population: the Beijing Eye Study. Br J Ophthalmol. 2005;89(9):1089-93.
- Sheedy JE, Bailey IL, Raasch TW. Visual acuity and chart luminance. Optom Vis Sci. 1984;61(9):595-600.
Table and Figure Headings
Table 1: Key information regarding testing settings and charts.
| Chart | Chart Type | Range of VA and Units | Number of Lines | Intended Distance (ft) | Actual Distance (±0.07ft) | Working Lens | Room
Luminance (cd/m2) |
Chart Light Source | Chart
Luminance (cd/m2) |
| Snellen Vision Box | Snellen | Fraction 20/200 to 20/12.5 | 9 | 20 | 18.83 | <0.01D
(negligible) |
105 | LED | 130 |
| Nidek Space Saving Chart SSC-370 | Snellen(uses logMAR step chart) | Decimal 0.2 to 2.5 | 15 | 16.4 | – | – | 56 | LED | 75 |
| Nidek Projector Chart CP-690 | logMAR (ETDRS) | Decimal 0.05 to 2.0 | 20 | 10 | 9.00 | 0.03D
(negligible) |
138 | LED | 90 |
| AppasamyiChart LITE (LCD chart) | logMAR (ETDRS) | logMAR 0.78 to
-0.04 |
7 | 10 | 9.42 | 0.02D
(negligible) |
130 | LCD | 80 |
Table 2: Inter-chart variation in VA for both observers at each increment of induced optical blur using spherical and cylindrical powers.
| Optical Blur | Inter-Chart Variation in VA Measured (logMAR) | ||
| Observer 1 | Observer 2 | ||
| BCVA | 0.20 | 0.12* | |
| + Sphere (D) | 1 | 0.07* | 0.22 |
| 2 | 0.54 | 0.53 | |
| 3 | 0.40 | 0.15* | |
| + Cylinder (D) | 1 | 0.25 | 0.17* |
| 2 | 0.26 | 0.45 | |
| 3 | 0.28 | 0.22 | |
Table 3: Loss of lines of VA for both observers between each diopter of spherical and cylindrical power, and inter-chart variability for incremental losses.
| Incremental
Optical Blur |
Loss of Lines of VA (logMAR) | ||||||||||
| Observer 1 | Observer 2 | ||||||||||
| Incremental Loss of VA | Inter-Chart
Variation |
Incremental Loss of VA | Inter-Chart
Variation |
||||||||
| LED | Snellen | Projector | Space
Saving |
LED | Snellen | Projector | Space
Saving |
||||
| + Sphere (D) | BCVA to 1 | 0.40* | 1.18* | 2.44 | 2.92 | 2.52 | 0.80* | 3.52 | 1.63* | 2.04 | 2.72 |
| 1 to 2 | 3.40 | 8.35 | 4.55 | 2.29 | 6.06 | 1.80* | 5.35 | 3.62 | 3.57 | 3.55 | |
| 2 to 3 | 3.00 | 2.23 | 4.99 | 5.58 | 3.35 | 5.60 | 1.64* | 5.65 | 4.72 | 4.02 | |
| + Cylinder (D) | BCVA to 1 | 0.20* | 3.70 | 2.65 | 3.01 | 3.50 | 0.00* | 2.68 | 2.04 | 2.13 | 2.68 |
| 1 to 2 | 3.20 | 2.43 | 4.16 | 1.64* | 2.52 | 2.00 | 4.76 | 3.21 | 3.28 | 2.76 | |
| 2 to 3 | 2.00 | 2.74 | 0.79* | 5.53 | 4.74 | 5.80 | 1.43* | 1.74* | 2.83 | 4.37 | |
Table 4: Inter-chart variation in VA for both observers at each increment of induced media blur using the Bangerter Occlusion Foil Bar.
| Media Blur | Inter-Chart Variation in VA Measured (logMAR) | |
| Observer 1 | Observer 2 | |
| BCVA | 0.20 | 0.12* |
| 0.8 | 0.28 | 0.26 |
| 0.6 | 0.12* | 0.12* |
| 0.3 | 0.18* | 0.06* |
| 0.1 | 0.08* | 0.12* |
Table 5: Loss of lines of VA for both observers between each increment of media blur, and inter-chart variability for incremental losses.
| Incremental
Media Blur |
Loss of Lines of VA (logMAR) | |||||||||
| Observer 1 | Observer 2 | |||||||||
| Incremental Loss of VA | Inter-Chart
Variation |
Incremental Loss of VA | Inter-Chart
Variation |
|||||||
| LED | Snellen | Projector | Space
Saving |
LED | Snellen | Projector | Space
Saving |
|||
| BCVA to 0.8 | 3.20 | 4.77 | 5.84 | 3.20 | 2.64 | 3.40 | 4.77 | 3.77 | 2.50 | 2.27 |
| 0.8 to 0.6 | 0.40* | 0.00* | 0.79* | 3.01 | 3.01 | 0.20* | 0.98* | 1.28* | 2.91 | 2.71 |
| 0.6 to 0.3 | 1.80* | 1.77* | 1.16* | 0.00* | 1.80* | 2.00 | 0.79* | 1.52* | 0.78* | 1.22* |
| 0.3 to 0.1 | 2.80 | 3.00 | 1.85* | 4.17 | 2.33 | 2.40 | 3.00 | 3.42 | 2.62 | 1.02* |
Figure 1: The effect of working distance on the loss of lines of VA of two observers with the induction of optical blur using plus-powered spherical and cylindrical powers.
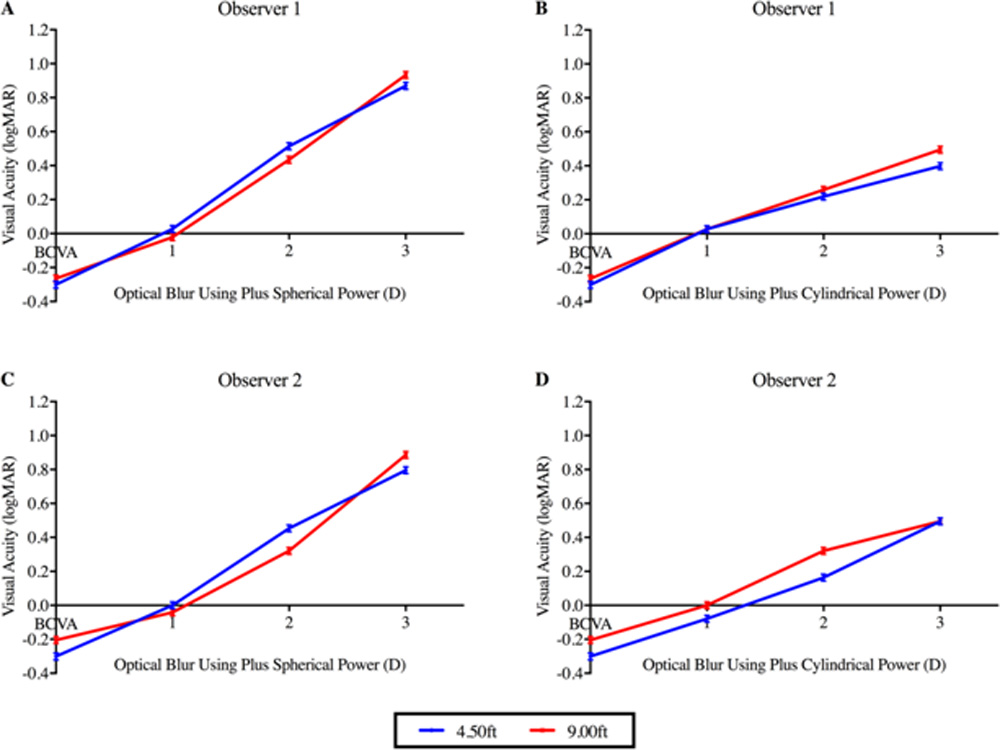
Figure 2: Variation in the VAof two observers on different charts with the induction of optical blur using plus-powered spherical and cylindrical powers.
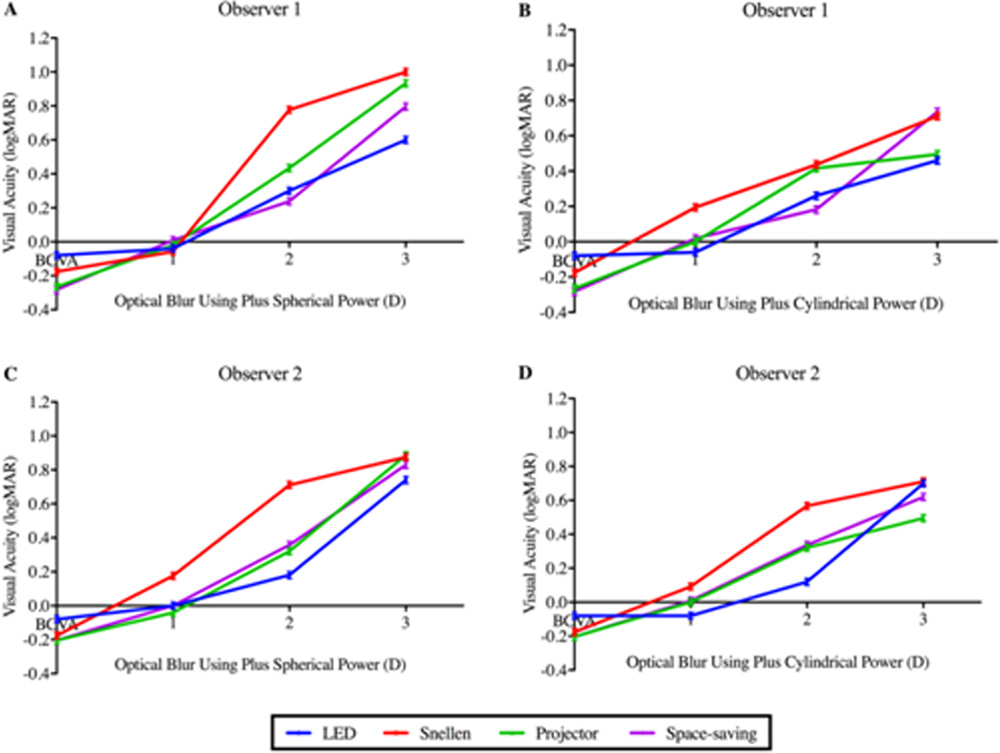
Figure 3: Loss of VA for both observerson different charts with the induction of media blur using a Bangerter Occlusion Foil Bar.
Leave a Comment