
Dr. Kavitha V, K09541, Dr. Sneha Harogoppa, Dr. B.S. Narendran, Dr. Mallikarjun M Heralgi
Abstract:
Purpose: Vision loss early in life has profound functional and psychological implications.Functional vision, defined as vision that can be used to perform a task(s) requiring vision,can be assessed by a number of tools. Questionnaires are a popular tool.This study aimed at assessing the visionrelated quality of life (QOL) with the help of a functional vision questionnaire (FVQ) and best corrected visual acuity (BCVA) following use of low vision aids (LVAs) in children with low vision.
Settings and design: Prospective longitudinal study.
Materials and Methods: Thirty children aged between eight and 18 years with low vision were recruited and prescribed low vision aids for distance and/or near based on their needs. The quality of life with the help of FVQ and BCVA were assessed at the first visit and then subsequently at one month, three months and six months. Descriptive and inferential statistical analyses were used. Student’s t-test was used to calculate the P value.
Results: There was a significant improvement in the vision-related quality of life as well as the BCVA from baseline to six months after use of low vision aids (P < 0.001).Conclusion:Low vision aids are effective in improving the vision-related quality of life and BCVA in children with low vision.
Key words: low vision, children, low vision aids, quality of life, visual acuity
Introduction:
The World Health Organizationhas defined low vision as visual acuity less than 20/60 to light perception in the better eye.[1]In children, low vision is ten times more prevalent compared to blindness.[2]An Indian study found lowvision prevalence of 1.05%, with 10.6 million people requiring low vision services.[3]Early diagnosis and intervention for a vision problem is crucial to maintain and maximize functional vision,[4] defined as vision that can be used to perform a task(s) requiring vision.[5]This study was conducted because of paucity in Indian literature regarding low vision aids and quality of life in children.[6]
Aim:
Our aim was to assess the quality of life following use of low vision aids in children with low vision with the help of a questionnaire and also toanalyze the improvement in visual acuity.
Materials and Methods:
This was a prospective longitudinal study of children with low vision who attended the outpatient department between July 2014 andMarch 2016.A sample size of 30 was calculated based on previous literature and at 1% level of significance (type 1 error) and 90% statistical power, with minimum sample size of eightwas calculated using n-Master software. Considering 10% of patients losing to follow up, 35 eligible children were recruited and first 30 children who completed all follow ups(six months) were analyzed.Children of either sex aged between eight and 18 years with BCVA <6/18 in the bettereye, with optic atrophy or heredomacular dystrophy or congenital anomalies like microcorneaand /or microphthalmos and /or colobomaor nystagmusor amblyopia due to various causes or albinism and who came for all follow ups were included in the study. Children with previous use of low vision aids, hearing impairment, developmental delay, progressive blindness like retinitis pigmentosaand any other health issues precluding follow up were excluded from the study. The study adhered to all the principles mentioned in the Declaration of Helsinki 2000.Informed consent was obtained from parents of all 35 children. All patients underwent a detailed ophthalmologic examination at baseline. Following parameters were assessed: UCVA and BCVA using Logarithm of the minimum angle of resolution (LogMAR) chart for distance and Snellen’s chart for near by a single person, ocular alignment and fixation by cover and alternate cover test, slit lamp examination, fundus examination (with indirect ophthalmoscopy using + 20 D condensing lens or slit lamp biomicroscopy using + 90 diopter (D) lens), cycloplegic refraction (1% cyclopentolate eye drops) with streak retinoscope, and subjective correction (three days later). Electrophysiological tests like ERG, EOG, VEP were carried out wherever indicated. A clinical diagnosis was made. BCVA was recorded and designated as baseline and spectacles were prescribed wherever needed. AFunctional Vision Questionnaire (FVQ), similar to LV Prasad Functional Vision Questionnaire[4] was constructedinlocal language and English,and administered to each child and parent /parents in order to assess quality of life or the difficulty in performing various day-to-day tasks. The fifteenquestions in the questionnaire are related to difficulties in performing certain tasks, which mainly rely on visual capabilities. The response was graded on a 5-point scale (0-4); a “Yes” or “No” response was first required for each question. If the answer was “No,” it was recorded as “No difficulty” (zero score). If the answer was “Yes,” then the difficulty level was further categorized into 1- 4 category; score 1 refers to “a little difficulty”, score 2 “ moderate difficulty”, score 3 “ great difficulty” and score 4 to “unable to do the activity.” The FVQ score, thus obtained, was designated as the baseline score.A LVA trial for distance (monocular or binocular telescope of 2.8x / 3x /4x /5x magnification)and / or near (magnifying lenses either 1.5x bar magnifier or 3x stand magnifier) was carried out by a single person. Those who showed improvement with LVA for distance and/or near, same was prescribed based on the child’s requirement and were followed up after one month, three months and six months. At each of these visits, BCVA for distance and nearwas recorded andFVQ was administered to assess the quality of life. The FVQ score and the BCVA at each of these visits were compared with the baseline.The data collected was analyzed using SAS 9.2, SPSS 15.0, Stata 10.1, MedCalc 9.0.1, Systat 12.0 and R environment ver.2.11.1. Descriptive and inferential statistical analyses were carried out. Student t test (two tailed, dependent) was used to find the significance (P value) of the study parameters. A significance level of 5% was used and the power was set to 90%.
Results
Out of 30 children, 20(66.7%) were in the age group of eight to12 years and 10(33.3%) were in the age group of 13-18 years.The mean age was 12.27±2.97 years. There were 20(66.7%) males and 10(33.3%) females. The most common diagnosis was pathological myopia found in nine patients (30%), followed by amblyopia in six patients (20%) and macular coloboma in sixpatients (20%). Other diseases encountered were retinochoroidalcolobomain threepatients (10%), albinism in threepatients (10%), nystagmus in twopatients (6.7%) and rubella retinopathy in one patient (3.3%).15 children (50%) were prescribed spectacles. 25 children (83.3%) were prescribed an LVA for distance. Monocular telescope was dispensed in 23 children (76.7%), of which the predominant type was 4x monocular in 14 children (Graph 1)and binocular telescope (2.8x) in two children (6.7%).16children (26.7%) were prescribed an LVA for near (Table 1)and three children (10%) were prescribed LVAs for distance as well as near. The mean UCVA for distance at the first visit in LogMAR scale was 0.96±0.10.48 eyes had a LogMAR value of 1; six eyes had UCVA of 0.8; and three eyes each had a value of 0.9 and 0.6. The most commonly recorded UCVA for near was N8 in 14 eyes (23.3%), followed by N10 in 12 eyes (20%), N12 and N18 in11 eyes each (18.3%), N36 in seveneyes (11.7%), N6 in four eyes (6.7%) and N24 in oneeye (1.7%).Table 2 shows the evaluation of BCVAfor distance from baseline to the end of the study (six months). Table 3 shows the distribution of BCVA for nearover a period of six months following use of LVA.BCVA with LVA for distance was between 0.5 and 1.00 in 43 eyes (72%) and < 0.5 in 17 eyes (28.3%). BCVAwith LVA for near was between N6 and N8 in 26 eyes (43.33 %); between N10 and N12 in six eyes (10 %) and none between N18 and N36. 15 eyes (25%) had no improvementwith LVA and 13 eyes (21.66%) did not need LVA trial for near. Table 4shows evaluation of the mean FVQ score, as well as the range of FVQ score, from baseline till the end of 6 months.
Discussion
The rationale for treatment of low vision in children is to utilize the residual vision in order to make them independent, to improve their educational experiences and employment opportunitiesthereby to enhance their self-confidence. Another important aspect of tackling the burden of low vision is differentiating visually impaired children from blind children, because erroneously classifying visually impaired children as blind deprives them a chance of rehabilitation. Many such students are enrolled in blind schools and educated using Braille, even though they may do well in regular schools.[7]
The mean age in our study was 12.27±2.97 years. 10 patients were females and 20 patients were males. Suma Ganesh et alconducted a study, to assess the impact of low vision rehabilitation on functional vision performance of children with visual impairment, which included 35 children, with a mean age of 10.5 ± 3.2 years (range: six-15 years), and male: female ratio of 4:1.[6]The common causes of low visionwere pathological myopia, macular coloboma, retinochoroidalcoloboma and amblyopia.This is similar to other studies.[2], [3]
In our study, 60 eyes underwent a low vision aid trial for distance. 25 children (83.3%) were prescribed an LVA for distance remaining five didn’t need it. Of the 60 eyes, 13 eyes did not undergo a low vision aid trial for near as their visual acuity was either optimal for routine daily activities or their visual acuity wasn’t impaired to the extent of hampering near tasks. Of the 47 eyes that did undergo a LVA trial, 15 did not show any improvement. Remaining 16 patients (32 eyes) that improved with LVAwere prescribed an aid for near. In the study conducted by Suma Ganesh et al, 29 children were prescribed low vision devices for near, 34 were prescribedlow vision devices for distance and 24 children were prescribed non-optical low vision devices.[6]
The mean BCVA was 0.91±0.13 at the first visit (day zero), which improved to 0.75±0.31 at the last follow-up visit (six months). At the last visit, nine eyes had BCVA for distance of£ 0.5 and 51 eyes had BCVA for distance in the range of 0.6-1. The improvement in BCVA from the baseline to the last visit was statistically significant ((p=0.002).This additional improvement in BCVA observed in these nine eyes implies that vision stimulation has occurred with the continuous use of LVA. This is an added benefit of use of LVA, which we have observed in our study.
In Suma Ganesh et al study, LogMAR visual acuity for distance prior to the introduction of LVAs was 0.90 ± 0.05. After intervention with low vision devices, this improved to 0.28 ± 0.27 and this improvement was statistically significant (P< 0.0001).[6] In a study conducted by Shaaban S et al, 50 patients were followed up for a period of six months following prescription of an LVA.Improvement of distance BCVA showed statistical significance (Wilcoxon signed rank test, p<0.001). Twenty-eight patients (56%) showed improvement of five lines or more. Nineteen patients (38%) showed improvement of three-four lines and three patients (6%) showed mild improvement of one-two lines.[12]
In our study, 32 eyes had a BCVA for near in the range of N6 to N10 on Snellen’s near vision chart (Numbers), 23 eyes had a near visual acuity in the range of N12 to N18 and five eyes had visual acuity in the range of N24 to N36. At the end of the study, 41 children had BCVA for near in the range of N6 to N10, 15 patients had visual acuity ranging from N12 to N24 and four patients had visual acuity of N24 to N36.Suma Ganesh et al, in their study found the mean LogMAR visual acuity for near prior to the introduction of low vision devices (LVDs) was 0.61 ± 0.05, which improved significantly to 0.42 ± 0.17 (p = 0.001).[6] In the study conducted by Shaaban S et al, overall improvement in near visual acuity was statistically significant (Wilcoxon signed rank test, p<0.001).[12]
There was a statistically significant (p <0.001) improvement in the mean FVQ score from baseline to six months. The mean score was 17.47±9.70 at baseline (day 0), 16.90±9.64 at the first follow-up (one month), 15.30±9.42 at the second follow-up (three months) and 13.30±8.88 at the last visit (six months).Thus, the quality of life consistently improved over the period of the study and this improvement was found to be statistically highly significant (p<0.001). Various studies have reported favorable outcome in the quality of life in visually impaired patients following use of low vision aids.[6],[8],[9],[10],[11],[12]
In the study conducted by Suma Ganesh et al to assess the impact of low vision rehabilitation on functional vision performance of children with visual impairment, L V Prasad – Functional Vision Questionnaire was used to assess the vision related quality of life. The LVP-FVQ score prior to use of low vision devices was 15.05 (range: 2-27), which improved to 7.58 (range: 0-24) after use of low vision aids.[6]
Gajdosova E. et al, in their study concluded that low vision aids were instrumental in improving the quality of life of children with residual vision.[9]
Similarly, Taha A. Labib et al in theirstudy concluded that vision rehabilitation with the use of optical vision aids is very helpful in minimizing the impact of low vision and in improving daily performance of the visually impaired patients.[8]
In our study, the more commonly reported difficulties were related to academic activities like reading/writing, copying letters from the blackboard, etc. The less commonly reported difficulties were related to outdoor activities like identifying a person waving from across the road, reading numbers on the bus, locating the ball while playing, etc. Almost none of the patients reported any difficulties relating to routine indoor life like lacing shoes, applying paste on toothbrush, locating the food on the plate, etc. With the use of low vision devices, the patients experienced most improvement in activities related to academics.
This highlights the importance of appropriate diagnosis and rehabilitation of low vision. Also, there is a need to educate health-care providers regarding the magnitude of the problem and also regarding low vision services.[13]
Limitations
- Follow up period in this study was short.
- Sustainability of the improvement in visual acuity and quality of life following discontinuation of low vision aids, if any could not be assessed.
- Near vision was measured using Snellen’s near vision chart and converted to N notation. Reduced LogMAR visual acuity chart for near wasn’t used.
- This study assessed only BCVA and quality of life. Other parameters like contrast sensitivity and visual fields could not be assessed.
Conclusion
Low vision aids are effective in improving vision-related quality of life in children with low vision. They are also helpful in improving the best corrected visual acuity following continuous use over a period of time, thus can act as a tool for vision stimulation.
Functional Vision Questionnaire
1. Do you have any difficulty in identifying a person across the road during the day?
Yes, No, Not applicable.
If yes, how much difficulty do you have?
● little
● A moderate amount
● A great deal
● Unable to do the activity
(Note: the same response options were used for all questions.)
2. Do you face any difficulty in walking alone in unknown surroundings, during daytime?
3. Do you have any difficulty in walking home at night, even with reasonable illumination?
4. Do you have any difficulty in reading the letters on the black- board while sitting on the first bench in your classroom?
5. Do you have difficulty in reading the vehicle/school bus numbers?
6. Do you face any difficulty in reading from hoardings?
7. Do you have any difficulty in reading books at an arm’s length?
8. Do you have any difficulty in writing neatly?
9. Do you have any difficulty in identifying cartoon characters on the television?
10. Do you find any difficulty in knowing the time when you see the wall clock?
11. Do you have difficulty in climbing up or down stairs?
12. Do you have difficulty in tying shoelaces?
13. Do have difficulty in locating toys while playing in the daylight?
14. Do you have difficulty in locating food on your plate while eating?
15. Do you have difficulty in identifying colors while painting?
References
1. World Health Organization. Global initiative for the elimination of avoidable blindness. WHO/PBL/97.61. Geneva: WHO, 1997.
2. Gothwal VK, Herse P. Characteristics of a low vision population in a private eye hospital in India. Ophthalmic Physiol Opt. 2000;20:212e219.
3. Shah M, Khan M, Khan MT, Khan MY, Saeed N. Causes of Visual Impairment in Children with Low Vision. Journal of the College of Physicians and Surgeons Pakistan 2011, Vol. 21 (2): 88-92.
4. Gothwal VK, Lovie-Kitchin JE, Nutheti R. The development of the LV Prasad- functional vision questionnaire: a measure of functional vision performance of visually impaired children. Invest Ophthalmol Vis Sci. 2003;44:4131e 4139.
5. Keeffe J. Assessment of low vision in developing countries. Book 2. Assessment of Functional Vision. Geneva: World Health Organization. WHO/PBL 95.48.
6. Ganesh S, Sethi S, Srivastav S, Chaudhary A, Arora P. Impact of low vision rehabilitation on functional vision performance of children with visual impairment. Oman J Ophthalmol. 2013 Sep-Dec; 6(3): 170–174.
7. Pal N, Titiyal JS, Tandon R, Vajpayee RB, Gupta S, Murthy GV. Need for optical and low vision services for children in schools for the blind in North India. Indian J Ophthalmol. 2006;54:189 e19
8. Labib TA, El Sada MA, Mohamed B, Sabra NM, Abdel Aleem HM. Assessment and management of children with visual impairment. Middle East Afr J Ophthalmol. 2009;16:64–8.
9. Gajdosová E, Kukurová E, Gerinec A. Improvement in the outcome of visual impairment using low vision aids in children. CeskSlovOftalmol. 2010 Dec;66(6):266-72.
10. Zheng Y, Sun B, Cui T.Use of visual aids for vision of disabled children. Zhonghua Yan KeZaZhi. 1999 Nov;35(6):459-61.
11. Stelmack JA, Tang XC, Reda DJ, et-al. Outcomes of the veterans affairs low vision intervention trial (LOVIT). Arch Ophthalmol. 2008;126:608-17.
12. Shaaban S, El-Lakkany AR, Swelam A, Anwar G. Low vision Aids provision for visually impaired Egyptian patients – a clinical outcome. Middle East Afr J Ophthalmol. 2009;16:29-34.
13. Khan SA, Shamanna B, Nuthethi R. Perceived barriers to the provision of low vision services among ophthalmologists in India. Indian J Ophthalmol. 2005;53:69–7
Graph 1: Percentage distribution of types of LVA (distance) prescribed
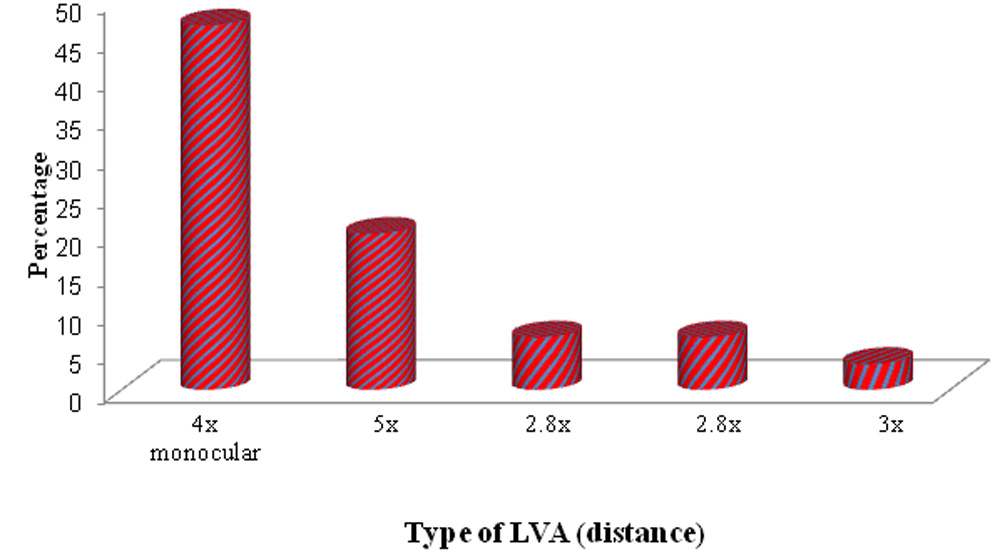
Table 1: Number of patients using LVA* (near)
| LVA(near) | Number of patients
(n‡=30) |
% |
| Nil | 22 | 73.3 |
| Yes | 8 | 26.7 |
| · 1.5x†Bar magnifier | 4 | 13.3 |
| · 3x stand magnifier | 4 | 13.3 |
*low vision aid, † magnification, ‡number.
Table 2: BCVA(distance): an assessment
| BCVA* (distance) | Day 0 | 1 month | 3 months | 6 months |
| ≤0.5 | 0(0%) | 2(3.3%) | 9(15%) | 9(15%) |
| 0.6-1 | 60(100%) | 58(96.7%) | 51(85%) | 51(85%) |
| Total | 60(100%) | 60(100%) | 60(100%) | 60(100%) |
| Mean ± SD† | 0.91±0.13 | 0.85±0.22 | 0.75±0.31 | 0.75±0.31 |
p value = 0.002(paired proportion test), *best corrected visual acuity, † standard deviation
Table 3: BCVA (near): an assessment
| BCVA (near) | Day 0 | 1 month | 3 months | 6 months | % change |
| N6 | 8(13.3%) | 8(13.3%) | 8(13.3%) | 8(13.3%) | 0.0% |
| N8 | 12(20%) | 12(20%) | 14(23.3%) | 16(26.7%) | 6.7% |
| N10 | 12(20%) | 12(20%) | 16(26.7%) | 17(28.3%) | 8.3% |
| N12 | 13(21.7%) | 14(23.3%) | 12(20%) | 10(16.7%) | -5.0% |
| N18 | 10(16.7%) | 10(16.7%) | 6(10%) | 5(8.3%) | -8.4% |
| N24 | 1(1.7%) | 0(0%) | 2(3.3%) | 2(3.3%) | 1.6% |
| N36 | 4(6.7%) | 4(6.7%) | 2(3.3%) | 2(3.3%) | -3.4% |
| Total | 60(100%) | 60(100%) | 60(100%) | 60(100%) | – |
*best corrected visual acuity
Table 4: FVQ score
| FVQ* score | Min† -Max‡ | Mean ± SD§ | Difference from day0 | P value from day0 |
| Day 0 | 6.00-38.00 | 17.47±9.70 | – | – |
| 1 month | 4.00-36.00 | 16.90±9.64 | 0.567 | <0.001** |
| 3 months | 3.00-35.00 | 15.30±9.42 | 2.167 | <0.001** |
| 6- months | 2.00-31.00 | 13.30±8.88 | 4.167 | <0.001** |
*functional vision score,†minimum, ‡maximum, SD: §standard deviation, P <0.001**
Figure legends:
Graph 1: Percentage distribution of types of Low Vision Aid (distance) prescribed
Leave a Comment