
Dr. Romit Salian, S17177, Dr. Narendran V, Dr. Karan A.K., Dr. Saravanan V R
ABSTRACT:
Aim:
To study and assess the role of OCT- Angiography, in detecting changes in foveal avascular zone characteristics in eyes with diabetic macular edema and to compare these characteristics with gold standard fundus fluorescence angiography.
Methods:
A cross sectional observational study conducted in our hospital from may 2016 to may 2017. 38 eyes of 21 patients with diabetic macular edema was included in the study. Each of these patients underwent comprehensive ocular and systemic evaluation. The data was compiled aftercomparing the Foveal Avascular Zone characteristics in Optical Coherence Topography-Angiography(OCT-A) and Fundus Fluorescein Angiography(FFA) in eyes with diabetic macular edema bythree independent observers in the form of greatest linear dimension(GLD), greatest horizontal diameter(GHD), greatest vertical diameter(GVD) and area of FAZ in OCT-A and FFA.
Results:
The difference of averages of the parameters calculated by paired t-test analysis in OCT-A and FFA was found to be statistically insignificant for GLD (p=0.253), FAZ Area (p=0.265), MHD(p=0.269) and MVD(p=0.585), with insignificant interobserver variation. A statistically significant (p=0.023) positive correlation of average FAZ area was seen with HbA1C andaverage GLD shows statistically significant variation with DM duration (p=0.045).
Conclusion:
OCT-A is a non-invasive technique to quantify FAZ for management of patients with DME.
Keywords:
Diabetic macular edema, foveal avascular zone, optical coherence tomography- angiography, fundus fluorescein angiography
INTRODUCTION
Diabetic retinopathy (DR) is a microangiopathy resulting from the chronic effects of the disease. Duration of the Diabetes Mellitus(DM) is the most important risk factor for DR.[1] The prevalence of diabetic retinopathy was found to be higher in women in the WESDR younger-onset group. However, in persons who have had diabetes for 19–20 years, 50% of men and 33% of women had proliferative retinopathy.[2],[3]
Vision loss in Diabetic retinopathy is most often caused by diabetic macular edema(DME). There is increased incidence of Diabetic macular edema (DME) seen in type 2 diabetes mellitus (DM) than in type 1 DM.[4] Visual acuity of such patients is often dependent on the central foveal involvement, perifoveal capillary blood flow velocity, severity of perifoveal capillary occlusion, and retinal thickness at the central fovea.[5][6]
Diabetic macular ischemia (DMI) is an important feature of diabetic retinopathy (DR). DMI is defined by an enlargement of the foveal avascular zone (FAZ) including the widening of paramacular areas of capillary nonperfusion.[7] It has been observed that approximately 41% of patients with DR in a tertiary hospital setting have some evidence of diabetic macular ischemia.[7] Recently, the RIDE and RISE trials analysis has shown that patients with DMI at baseline have progressed aggressively into proliferative changes seen in DR than those with normal perfusion at baseline seen during treatment with intravitreal ranibizumab.[8] Hence it has become very important to have a baseline assessment of DMI status using Fundus Fluorescein Angiography(FFA) before initiating the intravitreal injection of ranibizumab. This clinically helps the physician for planning the review schedule for patients receiving intravitreal injections. The areas of the FAZ have been validated as “correlated markers.”[9-16] in determining the progression of Diabetic retinopathy.
Fundus Fluorescein angiography (FFA) is considered the gold standard in detecting and evaluating retinal perfusion in clinical practice. Leakage of dye in the late phases of FA, is usually associated with the presence of cystoid macular spaces, which is used to identify macular edema.[17] Assessment of the level of macular ischemia is very important in noting the clinical and prognostic information which helps in determining the disease severity and progression[7,18-19]
Optical Coherence Tomography (OCT) has emerged as an important imaging modality in the evaluation and management of retinal diseases. The application of OCT to management of DME has been very useful. The degree of DME and response to therapy can be quantified on OCT. Specifically, the central subfield thickness (CST) can be used to follow a patient’s response to treatment of DME.
The recent development of OCT angiography (OCT-A) allows for the visualization of the retinal capillary layers and for the construction of microvascular flow maps.[20-26]
In our study we have compared the Foveal Avascular Zone Characteristics on Optical Coherence Tomography-Angiography and Fundus Fluorescein Angiography in Diabetic Macular Edema patients and we have correlated FAZ characteristics with vision and Foveal thickness.
MATERIALS AND METHODS
STUDY AREA–
The study was conducted in Aravind eye hospital, Coimbatore, Tamil Nadu, a tertiary eye care centre in Southern India catering services in specialities of ophthalmology.
STUDY POPULATION–
The study included urban, semi urban and rural population from in and around Coimbatore district. Data was collected from out-patients with diabetes mellitus attending retina clinic. Patients of both sexes were included in the study subject to inclusion and exclusion criteria.
STUDY PERIOD:-
The study was conducted between May 2016 to May 2017
STUDY DESIGN –
The study included a cross sectional comparative study design in patients with diabetic macular edema. In this study patients with diabetes mellitus with DME presenting to retina clinic out-patient department of Aravind Eye Hospital, Coimbatore were included, subject to the patient or their attendants signing the informed consent form.
Inclusion Criteria–
Established DM patients (type-2) with Diabetic Retinopathy seen on fundus examination and evidence of macular ischemia confirmed on FFA.
Age >18 years- must be able to provide informed consent.
Ready to undergo investigation by Fundus Fluorescence Angiography and Optical Coherence Tomography Angiography (OCT-A).
Exclusion Criteria–
- 6 months post-cataract surgery.
- Patients undergone previous retinal surgery or have had intravitreal injections.
- Patients with pathologic myopia.
- Patients with diabetes mellitus along with history of Ocular trauma.
- Patients with evidence of any other retinal vascular occlusions seen on fundus examination.
- Patients with glaucoma, optic nerve disorders causing visual loss.
- Patients with poor quality images on OCT angiography (signal strength index[SSI] lower than 50) owing to eye movements(un co-operative patients) or media opacities.
- Patients not willing to give written informed consent.
STATISTICAL METHODOLOGY
SAMPLE SIZE CALCULATION–
It is observed from the hospital record that there are about 1600 patients coming to our opd with our specification in a year. This study is a cross sectional comparative study. Thus, the following formula was applied to predict the sample size.
Where:
Z = Z value
p = percentage picking a choice
c = confidence interval
ss = sample size
Correction for Finite Population
Where:
FSS = Final Sample Size, pop = Population
In order to estimate the sample size, the subsequent values are applied Z = 95%, p = 50%, c = 16%, pop = 1600 and it produce the final sample size as 38. Hence, 38 eyes with diabetic macular edema seen clinically and on OCT underwent FFA and OCT-A, and FAZ characteristics where compared of the two investigating modalities.
STUDY DETAILS–
At the presentation of the patient, a detailed medical and ocular history was taken, including the duration of visual loss and the presence of any ocular pathologies or prior interventions. All patients underwent following ophthalmic examination-
- Uncorrected and Best-corrected visual acuity measured on Snellen’s chart.
- Intraocular pressure(IOP) measurement by Goldmannapplanation tonometry.
- Anterior segment evaluation by Slit lamp Examination.
- Posterior segment evaluation with slit lamp biomicroscopy using 90 D lens and indirect ophthalmoscope using 20D lens with scleral indentation with special care taken to identify all DR changes.
- On confirming the diagnosis of diabetic macular edema and those patients who fulfilled the inclusion criteria were being informed about the study. A written consent was taken from these patients to be included in the study following which they subsequently underwent the following investigations:
- SD-OCT examination- Each macular thickness map was been divided into nine standard macular subfields, out of which only central 1.2 mm diameter of fovea was taken into consideration. The central subfield is defined as a central circular area that had a diameter of 1.2mm.
- FFA examination- patients with normal renal function test were injected with 3 ml of 20% sodium fluorescein solution intravenously. Hiedelberg (confocal scanning laser ophthalmoscope) was used for taking contrast adjusted images at approximately 1 second intervals, beginning 5-10 seconds after injection and continuing through the various phases. The images inArterio-venous phase were taken into consideration.
- OCT-A-The device (DRI OCT TRITON Plus) was used for getting OCT-A images. This device performs each acquisition at a speed of 100 000 A-scans per second, using a 1050 nm super luminescent diode and with a bandwidth of 45 nm; 320 A-scans made up a B-scan while 320 horizontal and vertical lines separated by 9 µm each were sampled in the scanning area in order to form a 3-dimensional data cube of 6×6 mm area. Volumetric raster scans were obtained from 2 horizontal fast transverse scans and 2 vertical fast transverse scans acquired in 3.4 seconds each. The calculated amplitude decorrelation signal from the consecutive B-scans allowed visualization of blood flow, and therefore the capillary network, to be clearly visualized.
- The FAZ Characteristics from superficial capillary plexus obtained by OCT-A was taken into consideration by three independent observers while comparing these OCT-A images of eyes with Diabetic macular edema with FFA image of the same eye. The deeper capillary plexus were not compared as in FFA only superficial capillary plexus are visible. Following are the FAZ characteristics-Greatest linear dimension(GLD)- Shown in Figure 1 and 2.
- Area- Shown in Figure 3 and 4.
- Maximum Horizontal diameter(MHD)- Shown in Figure 5 and 6.
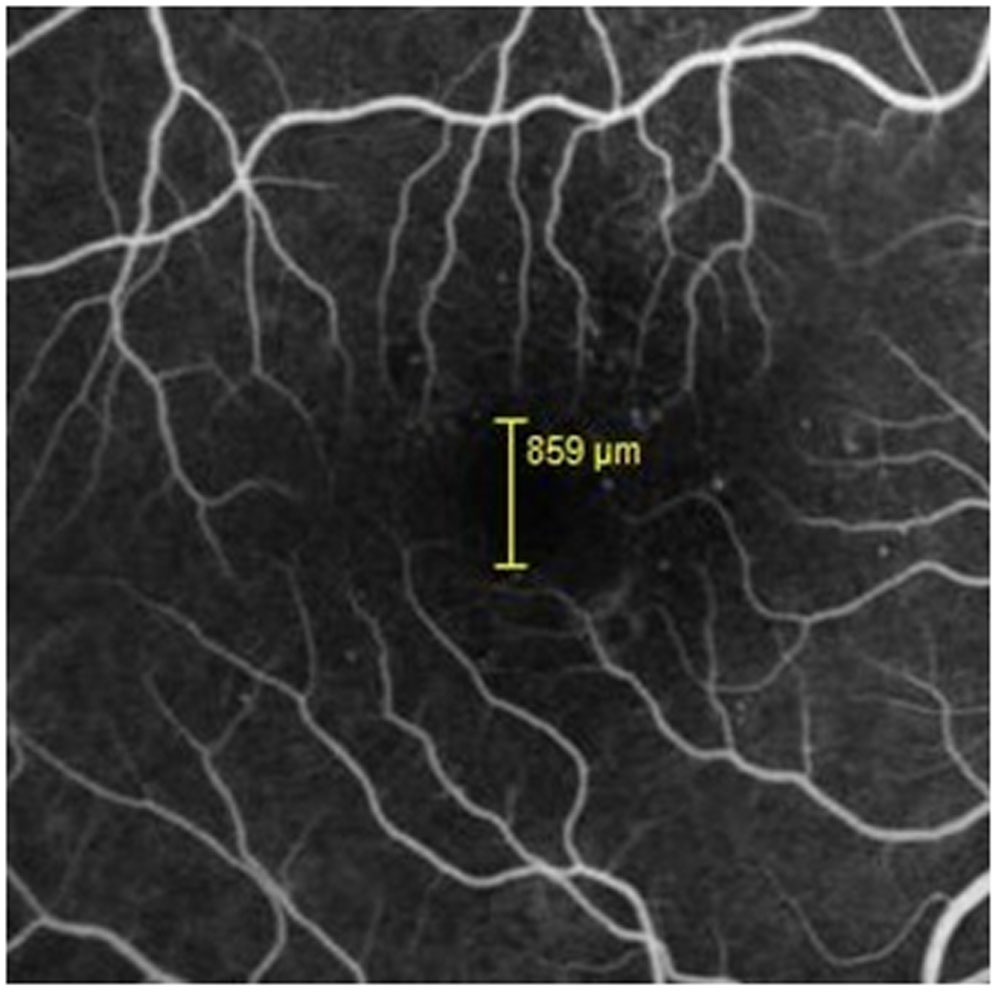
- Maximum Vertical diameter(MVD)- Shown in Figure 7 and 8.
The means of these observed values derived from OCT-A and FFA is compared in our study.
Data Analysis-
Paired t-test was used to test mean difference between the two continuous variables. Analysis of variance (ANOVA) is used to assess the significant difference among two are more categories of independent variable over dependent variable. p value less than 0.05 was considered as statistically significant. All statistical analysis was done on statistical software SPSS 16.0.
Results-
In our study, we enrolled 38 eyes of 21patients with diabetic macular edema, out of which 7 patients were less than 51 yrs of age, 6 were between 51-60 yrs while remaining 8 patients were more than 60 yrs old. The mean age of 38 patients included in our study was 56.13 yrs, while the mean of DM Duration found in our study was 8.91.In our study only one eye with mild NPDR presented with diabetic macular edema while majority of eyes (21) had moderate NPDR. 9 eyes had severe NPDR while 7 eyes had PDR.The mean value observed for HbA1C in our patients was 9.32 with a standard deviation of 2.30 while those for BCVA and Macular thickness was 0.19 and 316.67 respectively with standard deviation of 0.20 for BCVA and 111.04 for macular thickness.The Average of Greatest linear dimension (AvGLD) calculated from mean observations of three independent observers in OCT-A was 1074.17 micrometre while in FFA it was 1115.26 micrometre. Similarly the Average of FAZ areas in OCT-A was 0.642mm2and that in FFA was 0.686mm2.The average value of Maximum Horizontal Diameter of FAZ OCT-A was 949.55 micrometre while in FFA was 977.85 micrometre and the Average value of MVD of FAZ in OCT-A was 877.41 micrometre while in FFA was 886.23 micrometre.
In our study the comparison of average values done by paired t-test of all 38 eyes with respect to GLD seen in OCT-A and FFA showed insignificant difference with p-value of 0.253, similarly comparisons of average values of Area, MHD and MVD showed no significant difference with p-values of 0.265, 0.269 and 0.585 respectively. Also the interobserver variation was negligible.
In our study a positive correlation was noted between FAZ area of FFA, with HbA1C, while no correlation could be established between FAZ area seen in FFA with BCVA, macular thickness and DM duration.A similar positive correlation was noted between FAZ area of OCT-A with HbA1C as shown in table 1 and 2.
Discussion–
In our study we aimed at comparing the Foveal avascular zone characteristics in Optical coherence tomography- Angiography and Fundus fluorescein angiography in patients with Diabetic Macular Edema and correlating FAZ area with vision, diabetes mellitus duration, HbA1C and central macular thickness.
OCT-A is emerging as a new non-invasive imaging modality as compared to traditional FFA and is being used in studying the changes of Foveal Avascular Zone in various retinal vascular pathologies like Branch Retinal Vein Occlusion,[27]Central Retinal Vein Occlusion (CRVO),[28]Diabetic Macular Edema(DME)[29,30] and is used subsequently for prognosticating, monitoring and planning treatment strategies for patients with these disorders.
The mean value observed for HbA1C in our patients was 9.32 with a standard deviation of 2.30 was found to have positive correlation with FAZ area, which is similar to the study conducted by Hemalatha B C etal.[31]However other studies showed no correlation of FAZ area with glycemic index of patients with DM.[32]
The mean values of BCVA and Macular thickness was 0.19 and 316.67 respectively and showed no correlation (p-0.994) of FAZ area with CMT in our study. A Study conducted by Wasim A. Samara et al[33]using OCT-Ain normal individuals showed a statistically significant (p<0.0001) negative correlation between the FAZ area and central macular thickness stating that greater the FAZ area, thinner will be the CMT.
The normal FAZ area observed using OCT-A as perAbtinShahlaeeet al[34]is 0.27 ± 0.101 mm2 and the normal MHD and MVD is 0.59 ± 0.126, and 0.56 ± 0.118, respectively as seen in healthy individuals. This value of FAZ area was found to be similar in another study conducted by Deepa Johnet al[35]in which they used contrast adjusted FFA on HRA-2 for measuring the FAZ area (0.2753 ± 0.074 mm2) in normal individuals, which shows that the two modalities of investigation are comparable indeed in normal individuals.
Inter-observer agreement calculated by intraclass correlation coefficient(ICC) for FAZ parameters was high (ICC ≥0.90) in the above mentioned study by Abtin Shahlaee et al.[34] This result is similar to our study where p-values (p>0.05) for all the intergroup comparative analysis were found to be statistically insignificant thereby increasing the reproducibility of observations included in our study.
In the 38 eyes enrolled in our study, the Average of Greatest linear dimension (AvGLD) calculated from mean observations of three independent observers in eyes with moderate NPDR on OCT-A was 1045.90±176.79 micrometre while in FFA it was 1058.17±196.74 micrometre. The values of AvGLD on FFA correlate well with the study conducted byHemalatha B C, Sathyendranath Shetty,[31] in which eyes with moderate NPDR had greatest linear dimension as1120±260 micrometer. Even though we included eyes of patients with different stages of Diabetic retinopathy like NPDR(mild, moderate, severe) and PDR, majority of the eyes(21) included in our study belonged to Moderate NPDR group.
The mean FAZ areas(in mm2) observed in FFA in different stages of DR in various other studies and our study is enlisted in the table [3], while that in OCT-A in mild, moderate and severe NPDR and PDR observed in our study are 0.31, 0.60, 0.83 and 0.54 mm2 respectively.
Takase Net al[30] compared FAZ area of normal eyes with that of diabetic eyes using OCT-A and found that there is significant increase in the size of FAZ of superficial area in Diabetic eyes with retinopathy and without retinopathy (0.37 ± 0.07 mm² and 0.38 ± 0.11 mm² respectively) as compared to FAZ area of normal eyes (0.25 ± 0.06 mm²). Our study showed increase in the mean area of FAZ seen in DME on OCT-A in the superficial capillary plexus and FFA was 0.642mm2 and 0.686mm2. These findings were higher than the normal values of FAZ area observed in the above mentioned studies.[34,35]
CONCLUSION–
OCT-A can be used as an equally reliable diagnostic tool as FFA in studying FAZ parameters in Diabetic macular edema.
FAZ area showed positive co-relation with glycemic index (HbA1C) but no statistically significant relationship with visual acuity, DM Duration and central macular thickness.
Inter-observer variations in calculation of values of FAZ parameters are insignificant thereby showing the values of the various parameters calculated in the study are reproducible.
The absolute values of FAZ area, maximum horizontal diameter and maximum vertical diameter are larger in Diabetic Macular Edema patients as compared with patients with diabetes with no retinopathy and normal healthy individuals.
References-
- Chen MS, Kao CS, Chang CJ, Wu TJ, Fu CC, Chen CJ, et al. Prevalence and risk factors of diabetic retinopathy among noninsulin-dependent diabetic subjects. Am J Ophthalmol. 1992 Dec 15;114(6):723–30.
- Klein R, Klein BE, Moss SE, Davis MD, DeMets DL. The Wisconsin epidemiologic study of diabetic retinopathy. II. Prevalence and risk of diabetic retinopathy when age at diagnosis is less than 30 years. Arch Ophthalmol. 1984 Apr;102(4):520–6.
- Klein R, Klein BE, Moss SE, Davis MD, DeMets DL. The Wisconsin epidemiologic study of diabetic retinopathy. III. Prevalence and risk of diabetic retinopathy when age at diagnosis is 30 or more years. Arch Ophthalmol. 1984 Apr;102(4):527–32.
- Girach A, Lund-Andersen H. Diabetic macular oedema: a clinical overview. Int J ClinPract. 2007 Jan;61(1):88–97.
- Gardner TW, Larsen M, Girach A, Zhi X, Protein Kinase C Diabetic Retinopathy Study (PKC-DRS2) Study Group. Diabetic macular oedema and visual loss: relationship to location, severity and duration. ActaOphthalmol. 2009 Nov;87(7):709–13.
- Sakata K, Funatsu H, Harino S, Noma H, Hori S. Relationship of macular microcirculation and retinal thickness with visual acuity in diabetic macular edema. Ophthalmology. 2007 Nov;114(11):2061–9.
- Sim DA, Keane PA, Zarranz-Ventura J, Bunce CV, Fruttiger M, Patel PJ, et al. Predictive factors for the progression of diabetic macular ischemia. Am J Ophthalmol. 2013 Oct;156(4):684–92.
- Ip MS, Domalpally A, Sun JK, Ehrlich JS. Long-term effects of therapy with ranibizumab on diabetic retinopathy severity and baseline risk factors for worsening retinopathy. Ophthalmology. 2015 Feb;122(2):367–74.
- Bresnick GH, Condit R, Syrjala S, Palta M, Groo A, Korth K. Abnormalities of the foveal avascular zone in diabetic retinopathy. Arch Ophthalmol. 1984 Sep;102(9):1286–93.
- Arend O, Wolf S, Jung F, Bertram B, Pöstgens H, Toonen H, et al. Retinal microcirculation in patients with diabetes mellitus: dynamic and morphological analysis of perifoveal capillary network. Br J Ophthalmol. 1991 Sep;75(9):514–8.
- Mansour AM, Schachat A, Bodiford G, Haymond R. Foveal avascular zone in diabetes mellitus. Retina (Philadelphia, Pa). 1993;13(2):125–8.
- Conrath J, Giorgi R, Raccah D, Ridings B. Foveal avascular zone in diabetic retinopathy: quantitative vs qualitative assessment. Eye (Lond). 2005 Mar;19(3):322–6.
- Nelson DA, Burgansky-Eliash Z, Barash H, Loewenstein A, Barak A, Bartov E, et al. High-resolution wide-field imaging of perfused capillaries without the use of contrast agent. ClinOphthalmol. 2011;5:1095–106.
- Tam J, Dhamdhere KP, Tiruveedhula P, Manzanera S, Barez S, Bearse MA, et al. Disruption of the retinal parafoveal capillary network in type 2 diabetes before the onset of diabetic retinopathy. Invest Ophthalmol Vis Sci. 2011 Nov;52(12):9257–66.
- Kim DY, Fingler J, Zawadzki RJ, Park SS, Morse LS, Schwartz DM, et al. Noninvasive imaging of the foveal avascular zone with high-speed, phase-variance optical coherence tomography. Invest Ophthalmol Vis Sci. 2012 Jan;53(1):85–92.
- Tam J, Dhamdhere KP, Tiruveedhula P, Lujan BJ, Johnson RN, Bearse MA, et al. Subclinical capillary changes in non-proliferative diabetic retinopathy. Optom Vis Sci. 2012 May;89(5):E692-703.
- Coscas G, Cunha-Vaz J, Soubrane G. Macular edema: definition and basic concepts. Dev Ophthalmol. 2010;47:1–9.
- Classification of diabetic retinopathy from fluorescein angiograms. ETDRS report number 11. Early Treatment Diabetic Retinopathy Study Research Group. Ophthalmology. 1991 May;98(5 Suppl):807–22.
- Jia Y, Bailey ST, Hwang TS, McClintic SM, Gao SS, Pennesi ME, et al. Quantitative optical coherence tomography angiography of vascular abnormalities in the living human eye. Proc Natl AcadSci USA. 2015 May 5;112(18):E2395-2402.
- Spaide RF, Klancnik JM, Cooney MJ. Retinal vascular layers imaged by fluorescein angiography and optical coherence tomography angiography. JAMA Ophthalmol. 2015 Jan;133(1):45–50.
- Mariampillai A, Standish BA, Moriyama EH, Khurana M, Munce NR, Leung MK, et al. Speckle variance detection of microvasculature using swept-source optical coherence tomography. Opt Lett. 2008 Jul 1;33(13):1530–2
- Enfield J, Jonathan E, Leahy M. In vivo imaging of the microcirculation of the volar forearm using correlation mapping optical coherence tomography (cmOCT). Biomed Opt Express. 2011 Apr 13;2(5):1184–93.
- Chui TYP, Vannasdale DA, Burns SA. The use of forward scatter to improve retinal vascular imaging with an adaptive optics scanning laser ophthalmoscope. Biomed Opt Express. 2012 Oct 1;3(10):2537–49.
- Jia Y, Tan O, Tokayer J, Potsaid B, Wang Y, Liu JJ, et al. Split-spectrum amplitude-decorrelation angiography with optical coherence tomography. Opt Express. 2012 Feb 13;20(4):4710–25.
- Miura M, Makita S, Iwasaki T, Yasuno Y. Three-dimensional visualization of ocular vascular pathology by optical coherence angiography in vivo. Invest Ophthalmol Vis Sci. 2011 Apr;52(5):2689–95.
- Jia Y, Bailey ST, Wilson DJ, Tan O, Klein ML, Flaxel CJ, et al. Quantitative optical coherence tomography angiography of choroidal neovascularization in age-related macular degeneration. Ophthalmology. 2014 Jul;121(7):1435–44.
- Suzuki N, Hirano Y, Yoshida M, Tomiyasu T, Uemura A, Yasukawa T, et al. Microvascular Abnormalities on Optical Coherence Tomography Angiography in Macular Edema Associated With Branch Retinal Vein Occlusion. Am J Ophthalmol. 2016 Jan;161:126–132.e1.
- Coscas F, Glacet-Bernard A, Miere A, Caillaux V, Uzzan J, Lupidi M, et al. Optical Coherence Tomography Angiography in Retinal Vein Occlusion: Evaluation of Superficial and Deep Capillary Plexa. Am J Ophthalmol. 2016 Jan;161:160-171.e1-2.
- Di G, Weihong Y, Xiao Z, Zhikun Y, Xuan Z, Yi Q, et al. A morphological study of the foveal avascular zone in patients with diabetes mellitus using optical coherence tomography angiography. Graefes Arch ClinExpOphthalmol. 2016 May;254(5):873–9.
- Takase N, Nozaki M, Kato A, Ozeki H, Yoshida M, Ogura Y. ENLARGEMENT OF FOVEAL AVASCULAR ZONE IN DIABETIC EYES EVALUATED BY EN FACE OPTICAL COHERENCE TOMOGRAPHY ANGIOGRAPHY. Retina (Philadelphia, Pa). 2015 Nov;35(11):2377–83.
- Hemalatha BC S shetty B. Analysis of foveal avascular zone in different stages of non/proliferative diabetic retinopathy at a tertiary eye care hospital. Indian J ClinExpOphthalmol. 2015 Oct;1(4):202–217.
- Conrath J, Giorgi R, Ridings B, Raccah D. Metabolic factors and the foveal avascular zone of the retina in diabetes mellitus. Diabetes Metab. 2005 Nov;31(5):465–70.
- Samara WA, Say EAT, Khoo CTL, Higgins TP, Magrath G, Ferenczy S, et al. CORRELATION OF FOVEAL AVASCULAR ZONE SIZE WITH FOVEAL MORPHOLOGY IN NORMAL EYES USING OPTICAL COHERENCE TOMOGRAPHY ANGIOGRAPHY. Retina (Philadelphia, Pa). 2015 Nov;35(11):2188–95.
- Shahlaee A, Pefkianaki M, Hsu J, Ho AC. Measurement of Foveal Avascular Zone Dimensions and its Reliability in Healthy Eyes Using Optical Coherence Tomography Angiography. Am J Ophthalmol. 2016 Jan;161:50–55.e1.
- John D, Kuriakose T, Devasahayam S, Braganza A. Dimensions of the foveal avascular zone using the Heidelberg retinal angiogram-2 in normal eyes. Indian J Ophthalmol. 2011 Feb;59(1):9–11.
- Arend O, Wolf S, Remky A, Sponsel WE, Harris A, Bertram B, et al. Perifoveal microcirculation with non-insulin-dependent diabetes mellitus. Graefes Arch ClinExpOphthalmol. 1994 Apr;232(4):225–31.
Tables-
Table1: Showing correlation analysis between FAZ Area on FFA with BCVA, Macular thickness, HBA1C and DM Duration
| Correlations | Coefficient | p-value |
| Av-FArea vs. BCVA | -0.163 | 0.328 |
| Av-FArea vs. Macular Thickness | 0.001 | 0.994 |
| Av-FArea vs. HbA1C (%) | 0.407 | 0.023 |
| Av-FArea vs. DM Duration | 0.090 | 0.593 |
p-value £ 0.05 is significant
Table2: Showing correlation analysis between FAZ Area on OCT-A with BCVA, Macular thickness, HBA1C and DM Duration
| Correlations | Coefficient | p-value |
| Av-OArea vs. BCVA | -0.110 | 0.511 |
| Av-OArea vs. Macular Thickness | -0.128 | 0.455 |
| Av-OArea vs. HbA1C (%) | 0.403 | 0.024 |
| Av-OArea vs. DM Duration | 0.015 | 0.930 |
Table 3-Showing the FAZ area in FFA in Various studies in various stages of DR compared to our study.
| Various studies by | Mild NPDR | Moderate-severe NPDR | PDR | |
| Conrath J et al[9] | 0.30 | 0.42 | 0.61 | |
| Arend O et al[36] | 0.318 | 0.513 | 0.590 | |
| Mansour et al[11] | 0.737 | 1.001 | 0.866 | |
| Hemlatha et al[31]
|
0.36mm2±0.12
|
0.74mm2
±0.30 |
1.33mm2
±0.39
|
NA |
| Our Study | 0.313mm2 | 0.62mm2
±0.20 |
0.97mm2±0.62 | 0.56mm2±0.09 |
Figures-
Figure 1: Showing Greatest linear dimension of FAZ in OCT-A
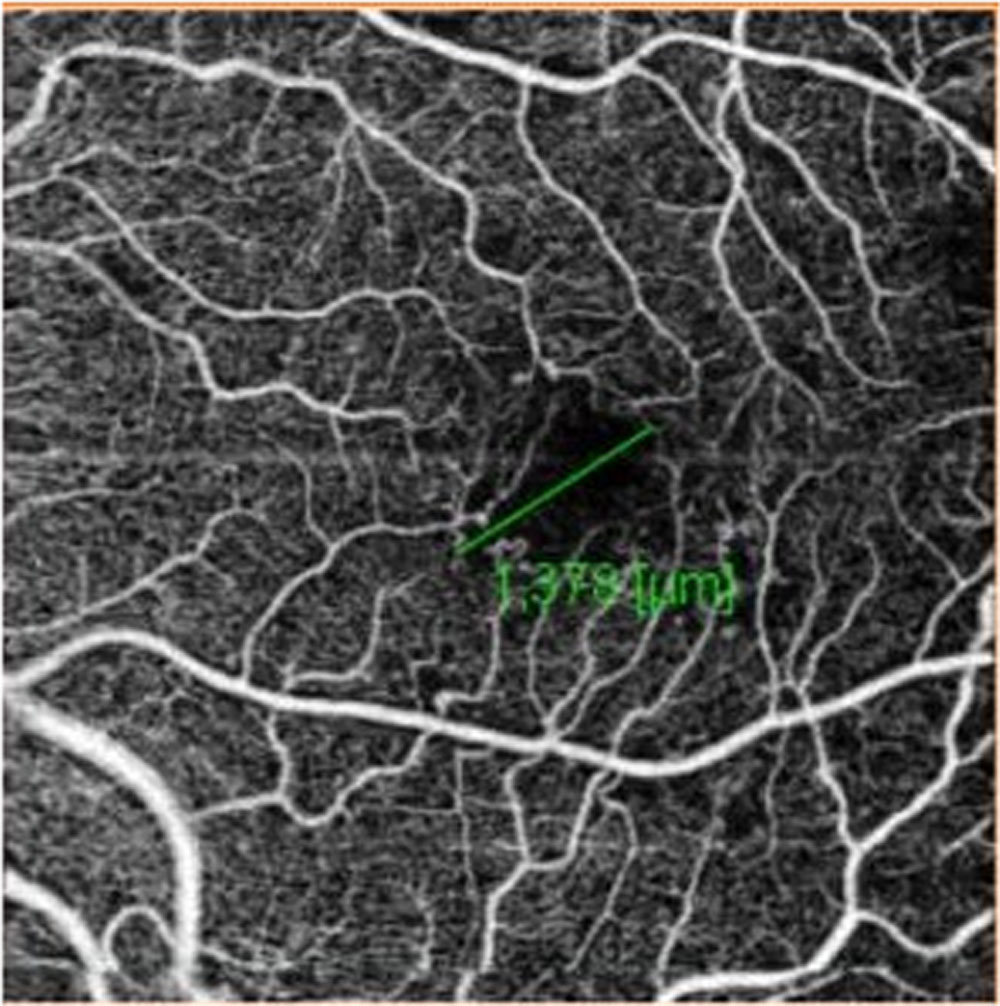
Figure 2: Showing Greatest linear dimension of FAZ in FFA
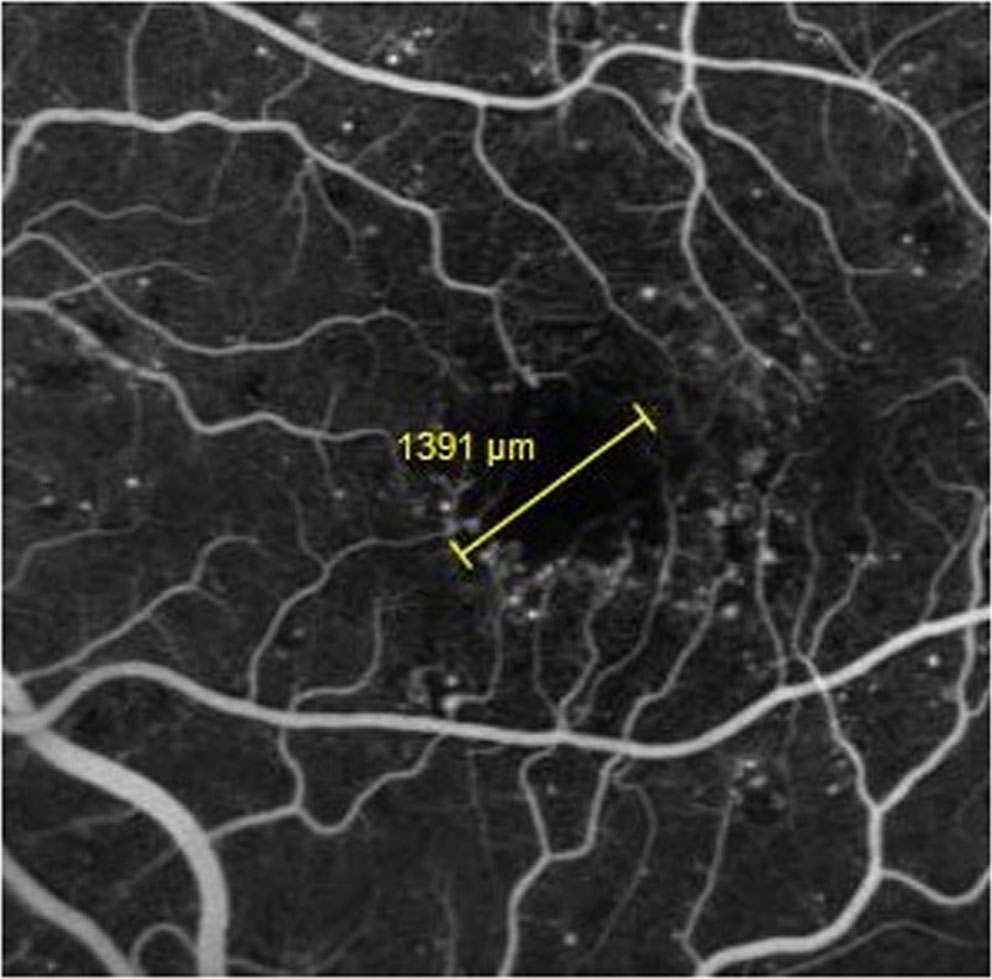
Figure 3: Showing FAZ Area on OCT-A
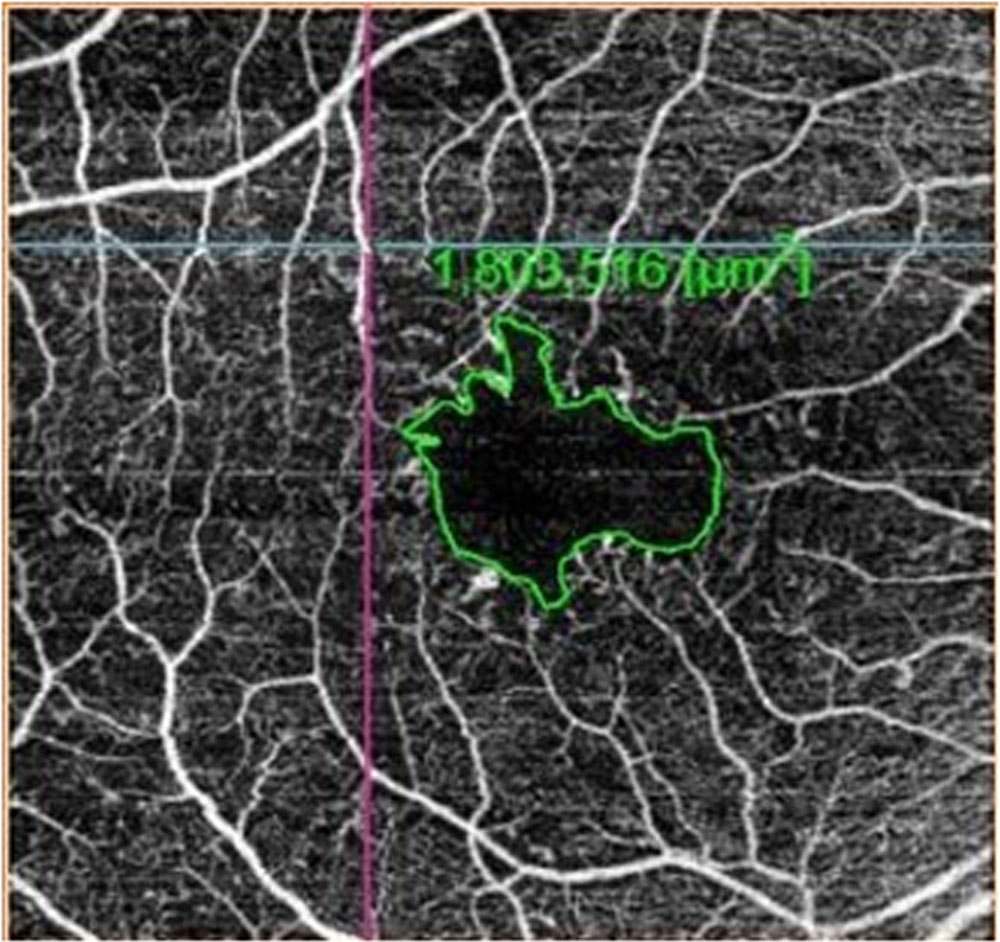
Figure 4: Showing FAZ Area in FFA
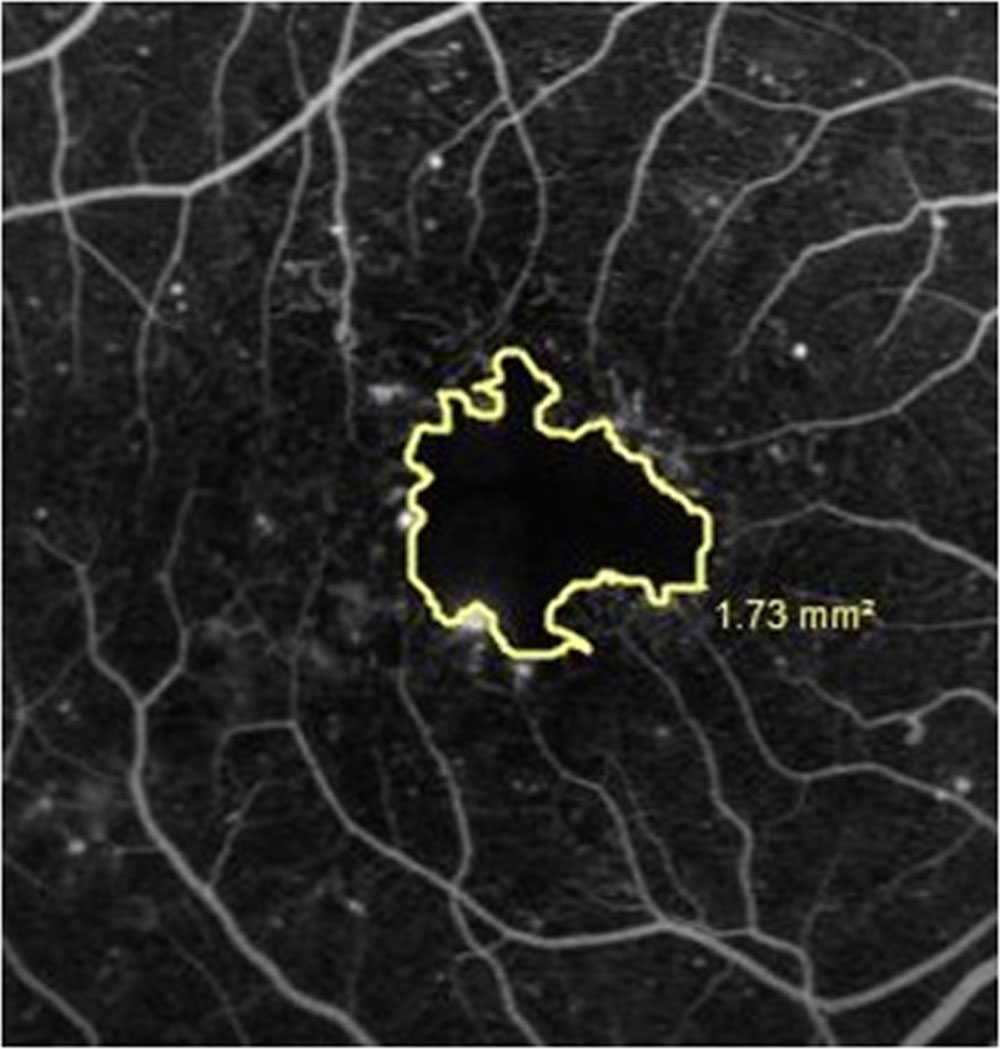
Figure 5: Showing Maximum Horizontal Diameter of FAZ on OCT-A
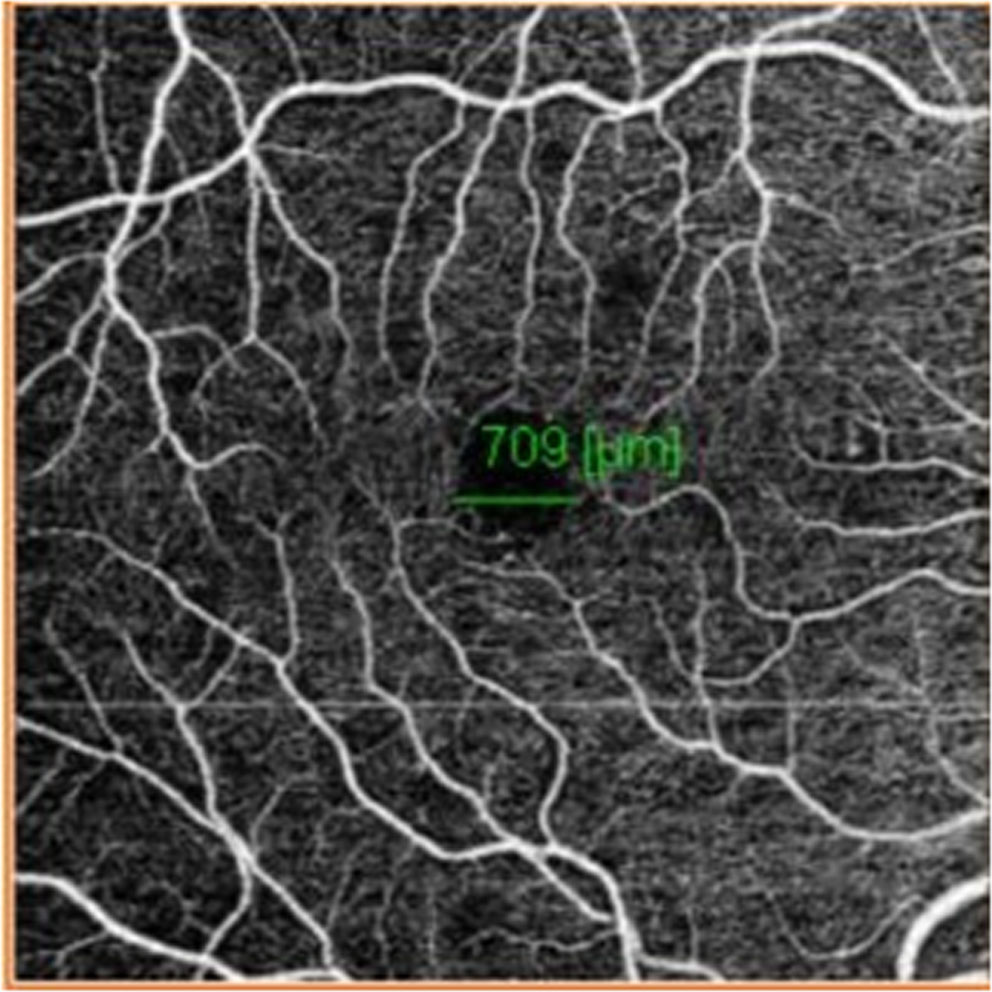
Figure 6: Showing Maximum Horizontal Diameter of FAZ in FFA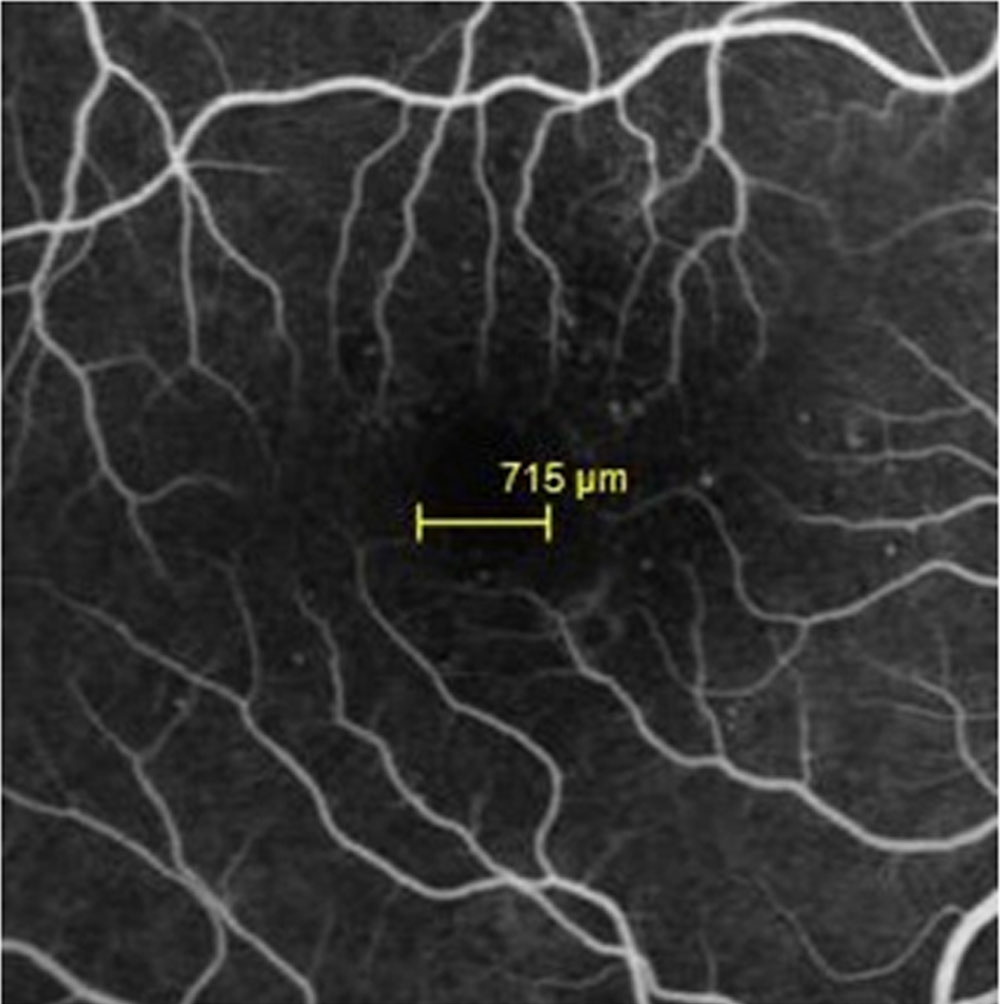
Figure 7: Showing Maximum Vertical Diameter of FAZ in OCT-A
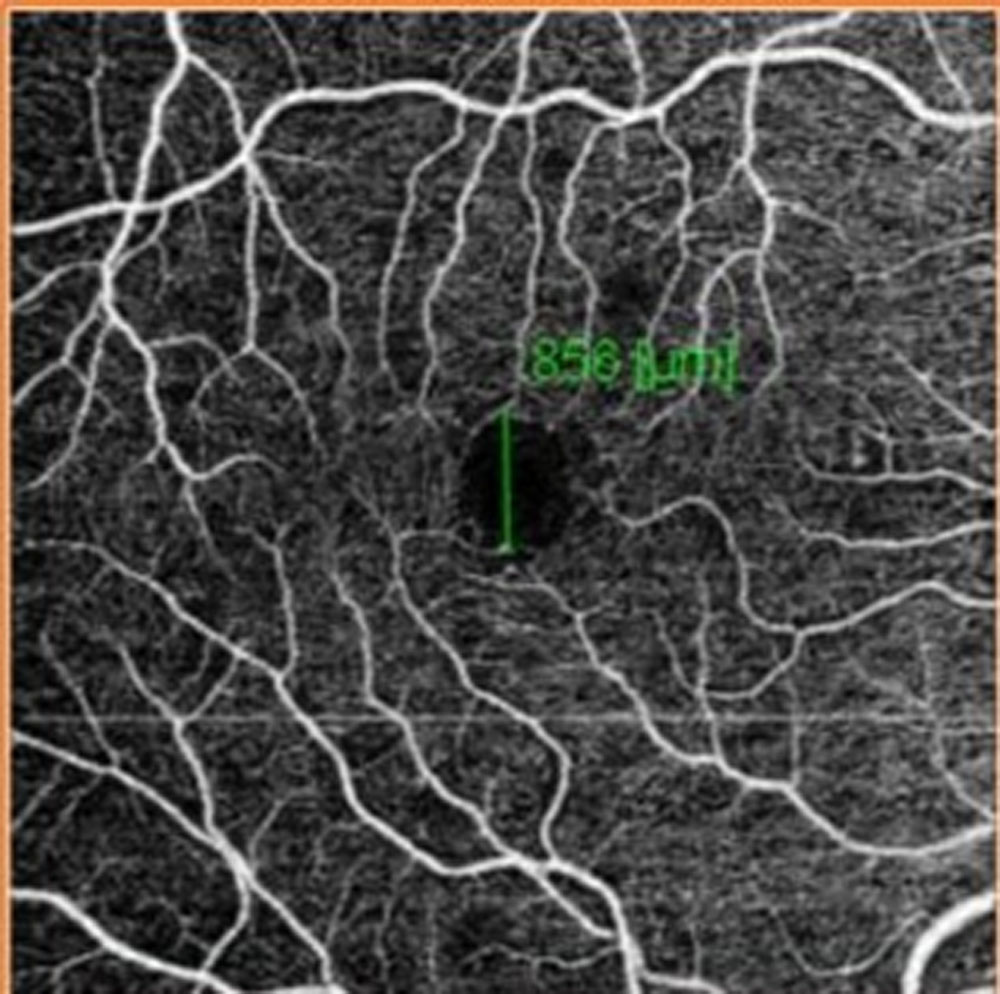
Figure 8: Showing Maximum Vertical Diameter of FAZ in FFA.
Leave a Comment