
Dr. Rachel Joseph, J14460, Dr. Jyoti S Shetty, Dr. Mohan Kannam
Abstract
a) Background:
The retinal ganglion cell layer is the first layer within the retina to be affected by early glaucoma. Almost 50% of RGC cells are located within the macula and patients with glaucoma can suffer 20% to 50% loss of RGCs before a defect becomes obvious on standard perimetry. Hence macular imaging is suggested to be an alternative scanning location to assess the neural damage in glaucoma.
b) Aim
To study the diagnostic ability of perimacular ganglion cell inner plexiform layer thickness in glaucoma and its correlation with retinal nerve fiber layer thickness and optic nerve head parameters using HD-Cirrus OCT in different optic disc sizes.
b) Materials and Methods:
Optic Nerve Head (200*200 scan protocol) and Macular Imaging (512*128scan protocol) with Cirrus HD OCT was performed on 100 eyes of 66 cases and 85 eyes of 50 controls.
Macular GCIPL thickness was assessed and correlated with peripapillary RNFL thickness and ONH parameters like disc area, rim area and cup volume
c) Results:
Mean GCIPL thickness was thinner in cases compared to controls (70.64±12.24 micrometers versus 79.58±0.51 micrometers). Mean RNFL thickness in cases was thinner compared with controls. (76.44±16.36 micrometers vs 90.62±27.57 micrometers).
Mean GCIPL segment thickness in all cases showed significant correlation (P<0.05) with corresponding mean RNFL quadrant thickness. Significant correlation was found in Large discs (P<0.05) but the level of significance decreased in medium discs (P value: 0.05<P<0.10).
Mean RNFL thickness showed statistically significant correlation to Rim area (P<0.001) in large and medium discs whereas mean GCIPL thickness showed significant correlation with rim area in large discs only. Other factors like disc area and cup volume did not show any correlation with mean RNFL & GCIPL thickness.
d) Conclusions:
RNFL thickness analysis still remains as the main quantitative analysis for Glaucoma. GCIPL thickness analysis can also be used as a surrogate parameter to assess RNFL loss where macular pathology has been ruled out.
e) Keywords:
GCIPL diagnostic ability in glaucoma, GCIPL and RNFL comparison, ONH parameters
Introduction
Imaging of RGCs is the most promising approach, for the diagnosis of glaucoma because the loss of RGCs is directly associated with the characteristic glaucomatous loss of visual field. However, imaging of retinal ganglion cells still remains a problem, because of the transparency of these cells [1]. Histologically GCIPL is the next best possible layer than can be used to quantify retinal Ganglion cells, which came into reality with the advent of newer generations of HD-OCT. [1] The uniform appearance, relative absence of vasculature, [18] presence of more than a single RGC body [17], less affected by ethnic differences and motion artifacts make the macula imaging a preferred location [19].
Material and Methods:
Using an Observational Cross-Sectional Comparative research design, we recruited patients attending Glaucoma clinic at tertiary eye care center for our study. Diagnosed cases of Glaucoma with ONH changes on slit lamp bio microscopy & characteristic visual field changes with refractive error between +4.0D to -4.0D in the age group of 20-90 yrs were chosen for the study. Eyes with previous or current vitreoretinal diseases, a history of previous retinal surgery or retinal laser treatment, evidence of diabetic retinopathy or macular pathology (E.g.: Macular edema, Macular Scar, etc.) and subjects with a history of dementia, multiple sclerosis, or life-threatening or debilitating disease were excluded from the study. Control eyes were randomly chosen among the patients attending general ophthalmology outpatient department in the same institute. Only eyes with no history or evidence of intraocular surgery and no retinal pathology, BCVA 6/6 or 6/9 and refractive error between +4.00 and −4.00 D, Intraocular pressure of ≤21 mm Hg, open angle on gonioscopy, normal optic disc and reliable normal visual field test and normal OCT were selected as controls. Data collection commenced after ethical clearance was obtained from the biomedical research and ethics committee with all participants giving written informed consent. The tenets of the Declaration of Helsinki were adhered to.
Personal details which include age, gender and history of previous medical and ocular conditions were noted. Detailed clinical examination was done which included Snellen’s visual acuity aided and unaided. Slit lamp examination of anterior segment, intraocular pressure, gonioscopy and Visual field test were done. Dilated fundus examination with Indirect Ophthalmoscopy using+20D and Optic Nerve Head with 90D was done. Optic Nerve Head (200*200) & Macular Imaging (512*128) scans were captured using Cirrus HD Optical Coherence Tomography. Macular GCIPL thickness diagnostic value was assessed and correlated with peripapillary RNFL and other ONH parameters like disc area, rim area and cup volume.
100 eyes of 66 subjects and 85 eyes of 50 controls were included in the study
Statistical Methods:
Student t test has been used to find the significance of study parameters between two groups.
Chi- square / Fisher Exact Test have been used to find the significance of study parameters on categorical scale between two or more groups.
Area under Receiver operating curve is used to study the diagnostic value of the test. (RFNFL and GCIPL)
Pearson correlation is performed to find the degree of relationship between the study categories
Results:
The mean age of the cases was 59.59±14.10 years and controls was 51±10.6 years. Males were predominant in both cases and controls. The mean RNFL thickness in cases was 76.44±16.36 micrometers and in controls was 90.62±27.57 micrometers. Mean RNFL thickness in each quadrant was thinner in cases compared to controls and showed significant correlation (p<0.05). Mean GCIPL thickness in each segment was thinner in cases in comparison to controls segments and showed significant correlation (p<0.05). The mean GCIPL thickness in Cases was 70.64±12.24 micrometers and in controls was 79.58±0.51 micrometers. Mean GCIPL thickness measurement and mean RNFL thickness measurement in all discs, large discs and medium discs had excellent diagnostic capability.
DIAGNOSTIC VALUE OF mean RNFL thickness AND mean GCIPL thickness:
Statistical data For Interpretation of AUC in ROC curves:
1)0.90-1 = excellent
2) 0.80-0.90 = good
3)0.70-0.80 = fair
4)0.60-0.70 = poor
5)0.50-0.60 = fail
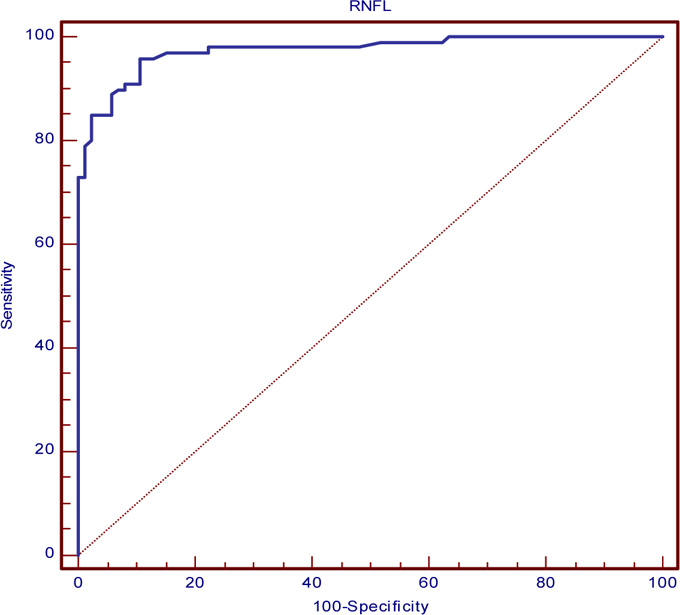
Area under Curve of ROC curve for mean RNFL (0.974) in all 100 Glaucomatous eyes.
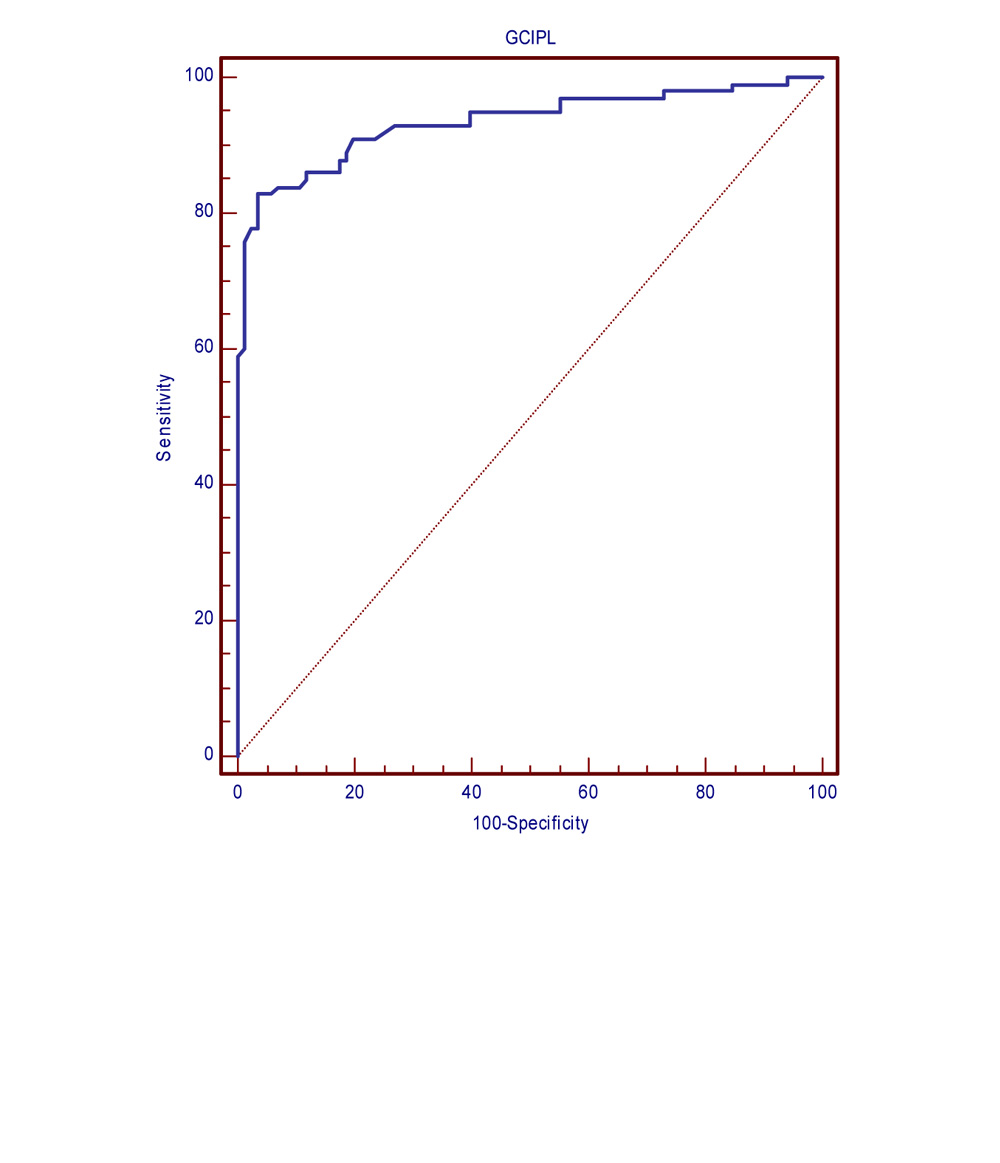
Area under Curve of ROC curve for mean GCIPL (0.934) in all 100 Glaucomatous eyes
The area under the receiver operating characteristic curves of mean RNFL and mean GCIPL showed excellent diagnostic ability in 100 Glaucomatous eyes
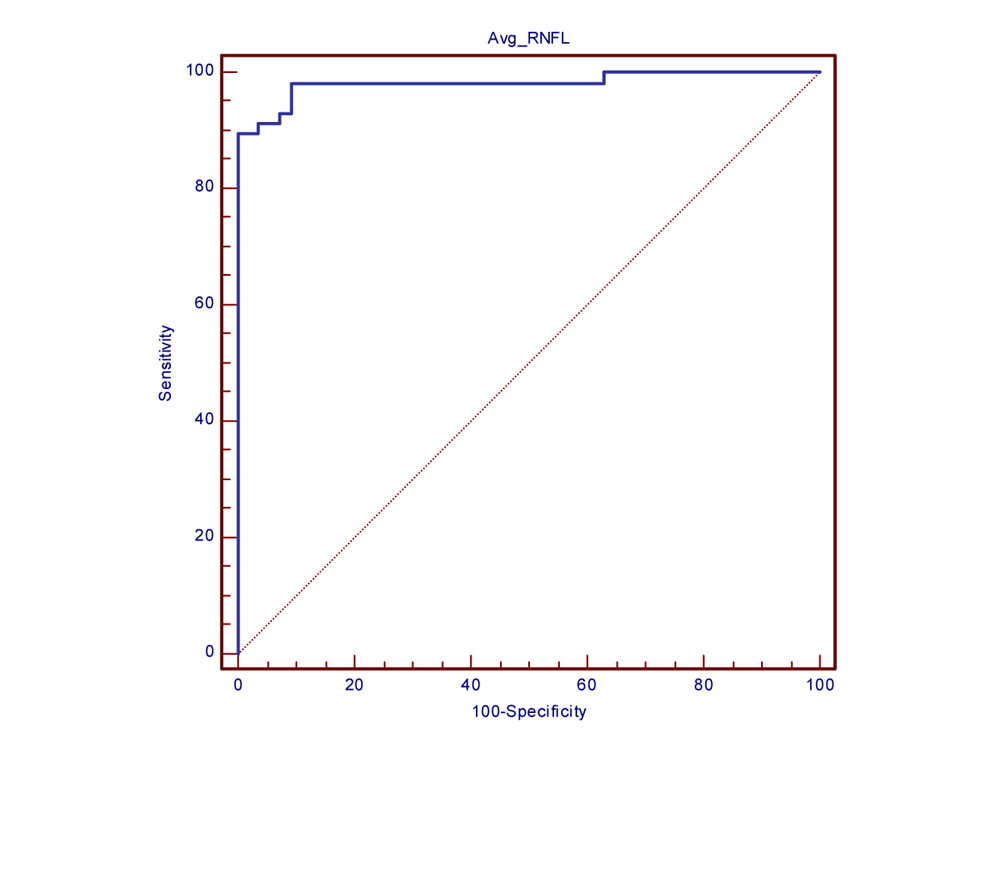
Area under Curve of ROC curve for mean RNFL (0.982) in Large Disc Glaucomatous eyes.
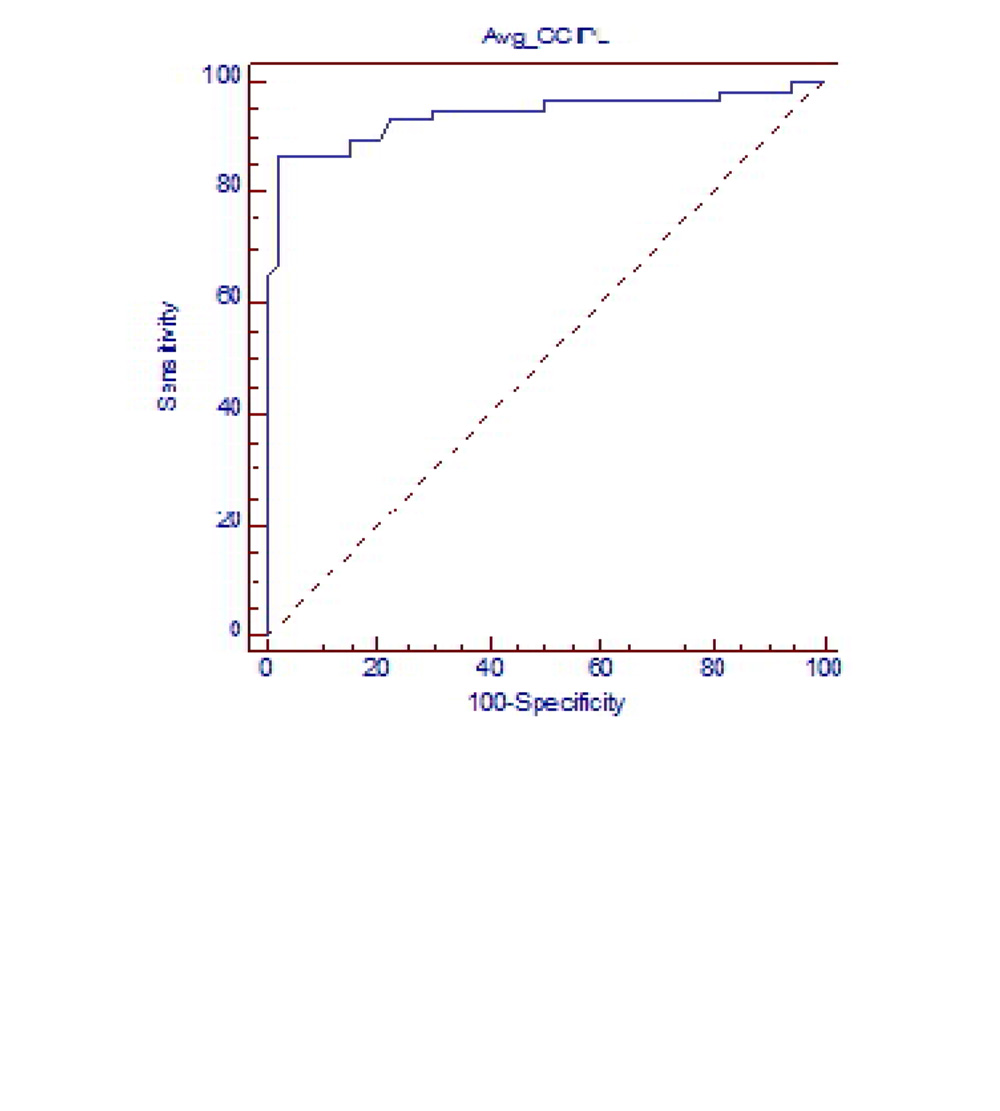
Area under Curve of ROC curve for mean GCIPL (0.919) in medium Disc Glaucomatous eyes.
AUC for mean RNFL thickness and mean GCIPL thickness in Medium disc showed excellent diagnostic ability.
RNFL quadrant thickness showed significant correlation (P<0.05) with corresponding
GCIPL segment thickness in all glaucomatous discs. Significant correlation was found in Large discs (P<0.05) but level of significance decreased in medium discs (P value:0.05<P<0.10) .
Mean RNFL thickness showed significant correlation with rim area in large and medium disc (P<0.05) other factors like disc area and cup volume did not show any correlation. Mean GCIPL thickness showed significant correlation with rim area in large discs only. Other factors like disc area and cup volume did not show any correlation
Discussion:
The results were analyzed and compared with similar previous studies.
Optic Disc size distribution:
The Disc Damage Likelihood Scale has been used to categorize optic discs into small, medium and large. Our study includes predominantly medium [42 eyes] and large discs [58 eyes] with no small discs in either cases or controls. Our results are similar with Hoffmann et al, study that showed medium to large size disc prevalence in Asian population [11]
In All discs:
Area under receiver operating characteristic curve was calculated for mean RNFL thickness (AUROC: 0.974) and mean GCIPL thickness (0.934) in all 100 Glaucomatous discs which showed excellent diagnostic capability to diagnose Glaucoma.
In Large discs:
AUC for mean RNFL thickness was 0.982 and mean GCIPL thickness in was 0.940 which showed excellent diagnostic capability.
In Medium discs:
Area under Curve of Receiver operating Characteristic curve for mean RNFL thickness was 0.954 and for mean GCIPL thickness was 0.919. This showed an excellent diagnostic capability.
Our study results are similar with Myung Hun Yoon et al., [8] study in which they concluded mean RNFL thickness and mean GCIPL thickness showed good diagnostic ability in all disc, large and medium discs.
Correlation of mean RNFL thickness and mean GCIPL thickness in all cases (100 Eyes):
In 100 subject eyes when RNFL quadrant thickness is correlated with GCIPL segments thickness by calculating Pearson correlation.
a) Inferior RNFL quadrant thickness showed significance correlation with Infero temporal, Inferior and Inferonasal GCIPL segments thickness.
b) Superior and temporal RNFL quadrants thickness showed significant correlation with superotemporal superior, superonasal and inferonasal GCIPL segments thickness.
c) Nasal RNFL quadrants thickness showed significant correlation only with superior segment thickness as expected because of anatomical variability in distribution of RNFL around the Macula.
Anatomically, ganglion cell axons from macular region are more likely to radiate towards temporal, superior and inferior poles of the optic disc compared to the nasal pole. With regard temporal, superior and inferior peripapillary RNFL thicknesses would correlate significantly with macular GC-IPL but none or weak correlation would be observed between nasal RNFL and macular GC-IPL thickness [12 ]David Huang et al in his paper explained that RNFL distribution is known to be nonuniform: as nerve fibers radiate out from the disc, they shift away from the nasal quadrant toward the temporal quadrant because the macula is temporal to the disc. This asymmetric divergence should make temporal RNFL thickness decrease more slowly and nasal RNFL thickness decrease more rapidly. [13]
Correlation of mean RNFL thickness and mean GCIPL thickness in Large Discs:
a) Inferior RNFL quadrant thickness showed significant correlation with Inferonasal, inferior GCIPL segments thickness and suggestive correlation with Inferotemporal segments thickness.
b) Superior RNFL quadrant thickness correlated significantly with superotemporal, superior, superonasal and inferior GCIPL segments thickness.
c) Temporal RNFL quadrant thickness showed significant correlation with superotemporal and superior GCIPL segments thickness.
d) Nasal RNFL quadrant thickness showed suggestive correlation with Inferotemporal GCIPL segment thickness
Correlation of mean RNFL thickness and mean GCIPL thickness in Medium Size Disc:
Only Superior quadrant RNFL thickness showed significant correlation with superior, supero temporal and Inferonasal GCIPL segments thickness. Inferior, nasal and temporal RNFL quadrants thickness did not show any correlation with GCIPL segments thickness.
Correlation between mean RNFL thickness and mean GCIPL thickness was significant in all 100 Glaucomatous eyes but the strength of correlation decreased from large to medium disc. This can be explained by 3.4mm fixed peripapillary scan diameter used in the OCT.
According to Carpineto and Savini et al, thickness of RNFL is inversely proportional to radius as shown below.
In a circular scan of the RNFL, T=A/2.pi.r
T=thickness of RNFL
R= r is the radius of the scan circle
Based on above formula the average RNFL thickness should be inversely proportional to the radius of the scan circle in the circumpapillary scan. The number of nerve fibers transected by the scan circle is diminished as the scan circle goes away from the optic disc margin. In large disc, as the scan margin falls close to the optic disc margin the number of fibres measured is more. This gives a false high thickness of circumpapillary RNFL. In moderate sized disc as the scan margin falls away from the disc margin and due to wider separation of nerve fibres the number of fibres measured is less. Thus, giving a false low thickness value [13, 14, 15.]
CORRELATION OF RNFL thickness AND GCIPL thickness WITH ONH PARAMETERS:
Mean RNFL thickness did not show any significant correlation with the optic disc area and cup volume in large and medium sized discs. However mean RNFL showed statistically significant correlation to Rim area (P<0.001) in large and medium discs. This can be explained by the thinning of neuroretinal rim with loss of RNFL fibres passing through optic nerve. This was similar to the finding in the study conducted by Tham YC, Cheung CY et al [16].
Mean GCIPL thickness did not show any significant correlation with the Optic Disc area and Cup volume in large and medium sized discs. However mean GCIPL thickness also showed a significant correlation to Rim area (P<0.001) in large discs only. We could not find any scientific explanation for this finding.
Myung Hun Yoon [8] et al and Huang et al [13] in their studies did not show any significant correlation between mean RNFL thickness ,mean GCIPL thickness to optic nerve head parameters. Yih-Chung Tham et al study showed only fair correlation between optic nerve head parameters to mean GCIPL and RNFL thickness [16]
- Conclusion:
RNFL thickness analysis still remains as the main quantitative analysis for Glaucoma. Our study shows that RNFL thickness correlates well with GCIPL thickness in large and medium discs. Both have excellent diagnostic capability in diagnosing Glaucoma. GCIPL thickness analysis can also be used as a surrogate parameter to assess RNFL loss in cases where RNFL analysis can be fallacious as in large peripapillary atrophy, abnormal disc vasculature and tilted disc provided macula pathology has been ruled out. RNFL thickness correlation with GCIPL thickness was not influenced by disc size. Rim area had significant positive correlation to mean RNFL thickness. Other optic nerve head parameters like disc area and cup volume did not show any correlation.
References
- Gadi Wollstein, and Joel S Schuman. OCT for Glaucoma Diagnosis, Screening And Detection Of Glaucoma Progression. British Journal of Ophthalmology.2013;98(2) : 15-19.
- Desatnik, Howard, Harry A. Quigley, and Yoseph Glovinsky. Study of Central Retinal Ganglion Cell Loss in Experimental Glaucoma In Monkey Eyes. Journal of Glaucoma.1996;5(1): 46-53.
- Zeimer, Ran et al. Quantitative Detection Of Glaucomatous Damage At The Posterior Pole By Retinal Thickness Mapping. Ophthalmology.105.2 (1998): 224-231.
- Frishman LJ, Shen FF, Du L, et al. The scotopic electroretinogram of macaque after retinal ganglion cell loss from experimental glaucoma. InvestOphthalmol Vis Sci. 1996;37: 125–141.
- Kerrigan-Baumrind LA, Quigley HA, Pease ME, et al. Number of ganglion cells in glaucoma eyes compared with threshold visual field tests in the same persons. Invest Ophthalmol Vis Sci.2000; 41: 741-748.
- Quigley, Harry A. Optic Nerve Damage In Human Glaucoma. Archives of Ophthalmology.1981;99(4): 635.
- Knighton, Robert W. and Giovanni Gregori.The Shape Of The Ganglion Cell Plus Inner Plexiform Layers Of The Normal Human Macula. Investigative Ophthalmology& Visual Science.2012;53(11): 7412.
- Yoon, Myung Hun et al. Glaucoma Diagnostic Value of the Total Macular Thickness and Ganglion Cell-Inner Plexiform Layer Thickness According to Optic Disc Area. British Journal of Ophthalmology. 2014; 98(3): 315-321.
- Koh, Victor T. et al. “Determinants of Ganglion Cell–Inner Plexiform Layer Thickness Measured By High-Definition Optical Coherence Tomography”. Investigative Ophthalmology& Visual Science.2012;53(9): 5853.
- Yang, Zhiyonget al. Diagnostic Ability of Macular Ganglion Cell Inner Plexiform Layer Measurements in Glaucoma Using Swept Source And Spectral Domain Optical Coherence Tomography. PLOS ONE.2015;10.5 .
- Hoffmann E, Zangwill L, Crowston J, Weinreb R. Optic Disk Size and Glaucoma. Survey of Ophthalmology. 2007;52(1):32-49.
- Kim NR, Lee ES, Seong GJ, et al. Comparing the ganglion cell complex and retinal nerve fiber layer measurements by Fourier domain OCT to detect glaucoma in high myopia. Br J Ophthalmol 2011; 95:1115–21
- Huang D, Chopra V, Lu A, Tan O, Francis B, Varma R. Does Optic Nerve Head Size Variation Affect Circumpapillary Retinal Nerve Fiber Layer Thickness Measurement by Optical Coherence Tomography. Investigative Ophthalmology & Visual Science. 2012;53(8):4990.
- Carpineto P, Ciancaglini M, Aharrh-Gnama A, Cirone D, Mastropasqua L. Custom measurement of retinal nerve fiber layer thickness using STRATUS OCT in normal eyes. Eur J Ophthalmol. 2005; 15:360–366 76
- Savini G, Barboni P, Carbonelli M, Zanini M. The effect of scan diameter on retinal nerve fiber layer thickness measurement using Stratus optic coherence tomography. Arch Ophthalmol. 2007; 125:901–905.
- Tham Y, Cheung C, Koh V, Cheng C, Siddhartha E, Strouthidis N Et al. Relationship between ganglion cell-inner plexiform layer and optic disc/retinal nerve fiber layer parameters in non-glaucomatous eyes. British Journal of Ophthalmology. 2013;97(12):1592-1597.
- Sung, Kyung rim et al. Macular assessment using optical coherence tomography for glaucoma diagnosis. British journal of ophthalmology.2012;96(12):1452-1455
- Yang, Zhiyong et al Diagnostic Ability of Macular ganglion cell inner plexiform layer measurements in glaucoma using swept source and spectral domain optical coherence tomography. PLOS ONE.2015;10.5
- Campbell RJ, Coupland SG, Buhrmann RR et al . Effect of eccentric and inconsistent fixation on retinal optical coherence tomography. Arch ophthalmol.2007;125:624-627
Leave a Comment