
Dr. Vidya sastry, V20023, Dr.Satish Shet, Dr. Vivekanand Jivangi, Dr. Venkatram Katti, Dr. Savitha Kanakpur
Visual acuity is the most frequently performed measure of visual function in clinical practice.(1)The concepts of “20/20” and “the big E” are familiar to patients and physicians in all fields of medicine. Visual acuity can be measured rapidly and inexpensively, with low-cost charts available commercially, online for printing, and increasingly for mobile devices.
Clinically, visual acuity is considered one of the vital signs of the eye and is measured at a predetermined distance, often using a Snellen chart. Developed in the 1860s, this chart has several design flaws, such as no geometric progression of letter size and variable number of letters used per line (e.g., “E” at the top of the chart and ≥5 letters on the 20/20 line). When measuring acuity in epidemiologic surveys or as an outcome in clinical research, the Snellen chart is insufficiently standardized, and other charts have been developed to address these deficiencies.2
The ETDRS chart was introduced, following recognition of the significant limitations of the Snellen chart, especially so in the low visual acuity range. The main improvements incorporated into the ETDRS chart include: an equal number of characters per row, an equal logarithmic decrement between successive rows; and the use of character types which are of relatively uniform legibility (3, 4).In situations where the use of alphabet based optotypes is not possible, such as when subjects are illiterate or cannot read Latin characters, the tumbling E optotypes are commonly used. (5, 6)
The reproducibility achieved during VA testing using each of these two commonly used charts has been previously studied. (7-9)
Mobile telephone technology has evolved rapidly in recent years. In 2013, an estimated 280 million (20%) of the 1.4 billion mobile telephones sold were smartphones and this proportionis expected to increase, particularly in low-income settings.(10) The medical community is embracing mobile technologieswith its potential in health care information delivery, real time patient monitoring, research data collection, and mobile telemedicine for the provision of expertise to remote locations.(11)
The use of mobile phone technology for the delivery of health care is rapidly expanding and there are more than 100 vision test apps in the Google Play Store. (12) REST – RAPID EYE SCREENING TEST(13) is one such application developed to measure visual acuity using a smart phone .It can be used by a non health care personnel and thus can help in easy visual acuity screening and thus help in recognition of eye diseases.The purpose of this study was to determine the agreement and correlation of the REST app in comparison with the standard ETDRS tumbling ‘E’ chart.
MATERIALS AND METHODS
This study was conducted in the month of February 2017 at 4 outreach cataract camps for a period of four weeks at Hubli. A total of 200 patients were screened at these camps of which 146 eyes had cataract.The exclusion criteria included patients with mature and traumatic cataract, vision worse than 6/60, corneal scar, and other retinal causes for low vision.
Non healthcare personnel who had volunteered for the study were trained to conduct the vision screening using the REST app. Patients with immature cataract were brought to our clinic and vision was rechecked using ETDRS vision charts(AkritiOculoplasty logistics, INDIA) by an ophthalmologist. Patients underwent complete ophthalmic examination and those with cataract wereplanned for surgery. The vision recorded for each eye using the REST app was compared with the ETDRS chart. The time taken for both was also noted.Visual acuity was then converted to logMAR(Minimal Angle of Resolution) for data analysis. Data analysis was done using SPSS software version 22.0.Pearson Correlation was used to determine the correlation between the two test methods.
The REST app(13) was written using HTML5 coding and is available for free on both Android and iOS operating system platforms for both smartphones and Ipads/Android tablets as well. The tumbling E chart is recreated in the app and the optotype size is calibrated according to the testing distance of either 1 metre or 3 metres. The touchscreen function in these devices plus the addition of sound cues in the app allow for the tester to perform testing without having to look at the screen
Calibration of the REST app(13)
An initial calibration of the REST app needs to be done prior to initial use. On the main screen, userneeds to click on the ‘‘Settings’’ tab. An option of 3 meters and 1 meter will be displayed and bothneed to be set. With the help of a ruler, the letter E displayed on the phone screen needs to bemeasured to 43 mm for 3 meters and 14 mm for 1 meter by sliding the toggle just below the E(Figure 3). Once the setting is done, user needs to click on save and the memory of the optosizing willbe saved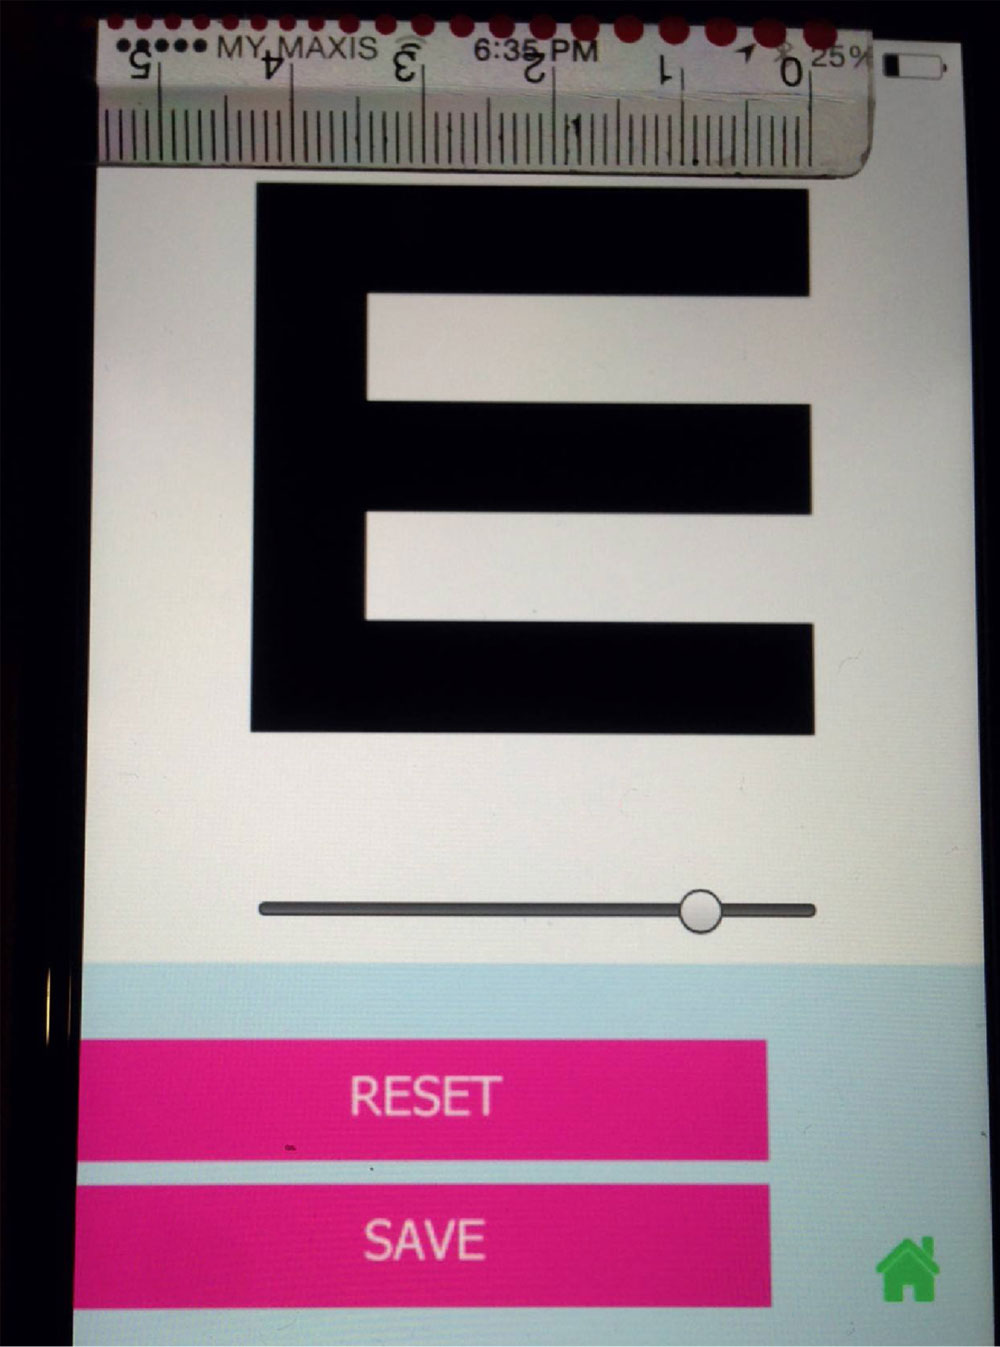
Instructions on how to use the REST app
The tester holds the smartphone or tablet at the preferred testing distance (either 1 or 3 meters) from the subject. Testing is done under normal lighting conditions and the device brightness is set to its highest setting.
- The subject is instructed to point with fingers to indicate the direction of the tumbling ‘E’ shown on the device.
- The tester then swipes accordingly. If the correct answer is given, a positive sound is played and the test proceeds to a smaller ‘E’. The test continues to reach a vision of 6/6 and a different positive sound will be played indicating end of testing.
- If the subject indicates a wrong direction anytime during the test i.e. the tester swipes to the wrong direction on the touchscreen, a negative sound will be played and the final vision will be displayed.
RESULTS
A total of 106 eyes of 200 patients with senile immature cataract were included in the study. The mean age of the patients was 52.8 years. The mean logMAR visual acuity measured by REST application was 0.785±0.211. The mean logMAR visual acuity using the ETDRS chart was 0.789 ± 0.210. There was a significant positive correlation between the two methods using the Pearson correlation (r= 0.995) and was statistically significant P<0.001.
The average time taken for vision recording using the REST app was 19.24±7.92 seconds and time taken with ETDRS chart was 21.64±9.71 seconds.
DISCUSSION
Visual acuity testing is an important first step in detecting reversible causes of visual impairment such as cataract and refractive errors(14,15). With most of the world’s blind people living in lowincome countries, the need for tools to increase early detection and appropriate referral are vital if the prevalence of blindness and visual impairment is to be reduced. (14)In the community setting, healthcare workers usually perform visual acuity testing with a variety of tools such as Snellen chart and Early Treatment Diabetic RetinopathyStudy (ETDRS) tumbling ‘E’ chart, which have been validated. (2,17)
. The REST app showed similar results as the ETDRS vision chart and is also less time consuming. The results obtained are similar to the study conducted by Chan JB et al (13)the other advantages of this tool are that it can be easily carried out by non health care personnel and thus help in early detection of patients with low vision.
LIMITATIONS OF THE STUDY
There are, however, limitations to the app. Patients with vision less than 6/60 could not be assessed.The screen contrast and brightness of the various touchscreen devices cannot be standardised due to the different builds and models. In addition, for the app to display properly, a minimum screen size of 3.5 inches is required. This is required due to the size of the optotype. As the REST app is run on digital devices, it is highly reliant on the battery lifespan of each individual device.
CONCLUSION
The REST app is a potentially ideal app for visual acuity assessment in the general population, especially where large number of patients have to be screened .Its compact portability, ease of use and intuitive testing method offer users a rapid yet accurate means of testing visual acuity.
REFERENCES
- Bastawrous A, Rono HK, Livingstone IAT, et al. Development and validation of a smartphone-based visual acuity test (Peek Acuity) for clinical practice and community-based fieldwork. JAMA Ophthalmol. 2015; 133(8):930–937.
- Ferris FL III, Kassoff A, Bresnick GH, Bailey I. New visual acuity charts for clinical research. Am J Ophthalmol. 1982; 94(1):91–96.
- Chen AH, Norazman FN, Buari NH. Comparison of visual acuity estimates using three different letter charts under two ambient room illuminations. Indian J ophthalmol 2012;60(2):101-104
- Bailey IL, Lovie JE. New design principles for visual acuity letter charts. Am J OptomPhysiol Opt1976;53(11):740-745.
- Plainis S, Tzatzala P, Orphanos Y, Tsilimbaris MK. A modified ETDRS visual acuity chart for European-wide use. Optom Vis Sci 2007;84:647Y53.
- Wittich W, Overbury O, Kapusta MA, Watanabe DH. Differences between recognition and resolution acuity in patients undergoing macular hole surgery. Invest Ophthalmol Vis Sci 2006;47:3690Y4.
- Shah N, Laidlaw DA, Shah SP, Sivasubramaniam S, Bunce C, CousensS. Computerized repeating and averaging improve the test-retest variabilityof ETDRS visual acuity measurements: implications for sensitivity andspecificity. Invest Ophthalmol Vis Sci2011;52(13):9397-9402.
- Kuo HK, Kuo MT, Tiong IS, Wu PC, Chen YJ, Chen CH. Visual acuity as measured with Landolt C chart and Early Treatment of Diabetic Retinopathy Study (ETDRS) chart. Graefes Arch ClinExpOphthalmol2011;249(4):601-605.
- Laidlaw DA, Abbott A, Rosser DA. Development of a clinically feasible logMAR alternative to the Snellen chart: performance of the “compact reduced logMAR” visual acuity chart in amblyopic children.Br J Ophthalmol2003;87(10):1232-1234.
- Hemel J. How blackberry does it. Strategic Direction. 2010;26(2):92-100
- Bastawrous A, Armstrong MJ. Mobile health use in low- and high-income countries: an overview of the peer-reviewed literature. J R Soc Med. 2013;106(4):130-142.
- Pereira C, Chakrabarti R, Islam FM, Crowston J. The Eye Phone Study: reliability and accuracy of assessing Snellen visual acuity using smartphone technology. Eye (Lond). 2015; 29(7):888–894.
- Jan-Bond C, Wee-Min T, Hong-Kee N, Zu-Quan I, Khairy-Shamel ST, Zunaina E, Liza-Sharmini AT. REST–An Innovative Rapid Eye Screening Test. Journal of Mobile Technology in Medicine. 2015 Oct 30;4(3):20-5.
- Wang F, Tielsch JM, Ford DE, Quigley HA, Whelton PK. Evaluation of screening schemes for eye disease in a primary care setting. Ophthalmic epidemiology. 1998;5(2):69-82.
- Quigley HA, Park CK, Tracey PA, Pollack IP. Community screening for eye disease by laypersons: theHoffberger program. American journal of ophthalmology.2002;133(3):386-92.
- Sheldrick JH, Vernon SA,Wilson A. Study ofdiagnostic accord between general practitionersand an ophthalmologist. BMJ. 1992;304(6834):1096-1098.
- McGraw P, Winn B, Whitaker D. Reliability of the Snellen chart. Bmj. 1995;310(6993):1481-2.
Leave a Comment