
Dr. Upma Awasthi, A13917, Dr. Ajay Aurora
Introduction
Diabetic retinopathy (DR) is a retinal vascular disease. Retina is divided into 2 zones as per vascular supply; outer retinal layers and inner retinal layers. Outer retinal layers consist of 4 layers and are supplied mainly by choroid and retinal vasculature. Rest inner 6 layers are supplied by retinal vasculature. (1)
Recently, spectral-domain optical coherence tomography (SD-OCT) has allowed more direct in vivo assessment of the retinal microstructure. Several OCT studies have shown thinning of the inner retinal layers, including the ganglion cell layer and retinal nerve fiber layer, in patients with DM. This is termed as disorganization of retinal inner layers (DRIL).(1,2) In long standing macular edema, outer retinal layers also get distorted and this is termed a disorganization of retinal outer layers (DROL). Few studies have shown DRIL as independent predictor of visual acuity while others found no direct correlation. (2,3)
Also the detailed evaluation of foveal avascular zone(FAZ) is possible with fundus flourescein angiography(FFA ) and optical coherence tomography angiography(OCTA). Various studies have shown change in FAZ correlate with change in retinal microstructure. Recently few studies have shown impact of FAZ distortion on visual acuity.(3,4)We have conducted this study to determine if OCT parameters and FAZ are predictors of visual acuity in diabetic retinopathy.
Methodology
In this retrospectivestudy, diabetic patients who attended our clinic from January 2016 to September 2016 were selected.
Patients with age 40 years or above with type 2 DM for more than 1 year and with clinical DR as per ETDRS grading Criteria were selected for the study. Patients with visually significant cataract and patients with retinal diseases other than diabetic retinopathy affecting vision were excluded.
They underwent detailed ocular examination.Best corrected visual acuity(BCVA) was recorded by Snellen’s chart and converted into LOGMAR values for statistical purpose.OCT was done with SD-OCT(Optovue) using raster scan protocol centered at fovea. Demographics and relevant clinical information about duration of diabetes and treatment history was also recorded.
FFA was done with Kowa Fundus Camera (Vx-20α). FAZ area was measured in pixels by special software tool. FAZ boundaries are marked with 12 points and the area covered is measured in pixels by software. (Image 1)
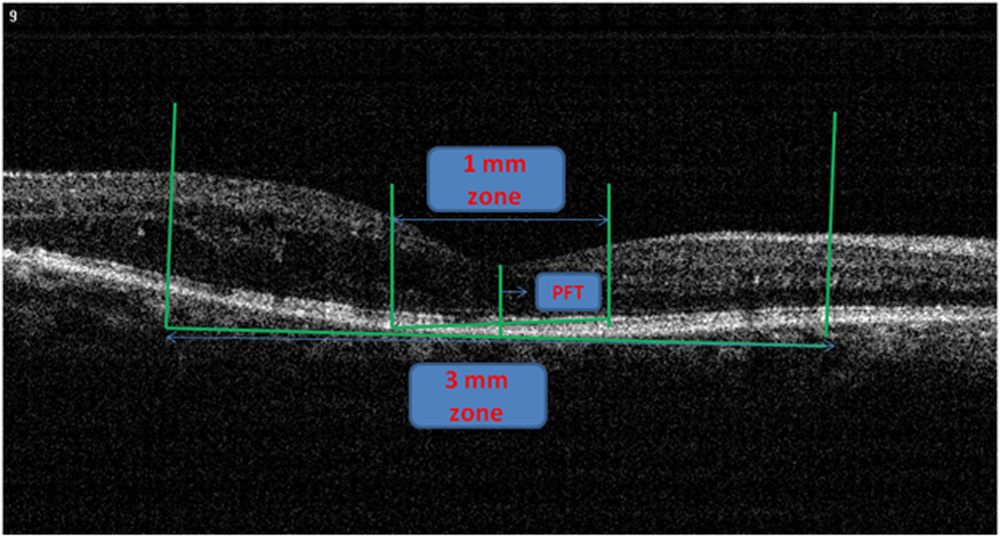
OCT was done with SD-OCT (Optovue) using raster scan protocol centered at fovea. Only the central foveal raster scan was marked with 1 and 3 mm zones and evaluated for the various parameters. For delineating zones, point foveal thickness (PFT) was marked first as per described in previous study.(3) With the OCT measuring tool 500 microns was marked both side of PFT thus giving central 1mm field. Same way 3mm zone was marked.(2) OCT parameters evaluated werecentral 1mm subfield thickness(CFT),(PFT), presence of cystoid spaces, cone outer segment tip(COST) layer,ellipsoid zone(EZ), external limiting membrane(ELM), DRIL in 1 mm and 3 mm zone.COST, EZ and ELM were collectively termed as DROL.
CFT was recorded from the central 1mm ETDRS grid as per software. If the boundaries drawn by software were found not appropriate then they were drawn manually and the resulting values were taken as CFT 1mm. CFT more the 250 was defined as diabetic macular edema(DME). (5)
PFT was measured in central foveal scan and distance measured was from retinal pigment epithelium (RPE) and internal limiting membrane(ILM). (3)
DRIL was defined as the inability to distinguish boundaries between any two of ganglion cell/inner plexiform layer complex(GC/IPL), inner nuclear layer(INL), and outer plexiform layer(OPL) in 50% of the zone. Horizontal extent of undefined boundaries was measured in microns both in foveal 1 mm and 3 mm zone.(2)
DROL is defined asdisruption in outer layers and were validated by 2 retina specialists. Cystoids spaces were defined as previously defined OCT criteria. (6)
Statistical analysis was done with R software using descriptive frequency and regression analysis.
Results
We have selected 62 eyes of 31 patients for our study. Out of these, OCT data was not available for 6 eyes while FFA pictures were available for 27 eyes. There were 2 eyes for which FFA reports were available but OCT report were not available thus 25 eyes of 14 patients were selected for the analysis. Among these patients, 9 were males and 5 were females. Mean age was 59.92 +/- 10.70 years (range 43-81 years). Mean age in male group was higher as compared to female group (62.33 vs 56.2 years). Mean BCVA was 0.30 +/-0.319 (range 1.3-0, CF 3 mt – 6/6). Mean BCVA was 1 line less in males (LOGMAR 0.335, 6/18+) as compared to females (LOGMAR 0.225, 6/12+).
Mean values of CFT and PFT were 312.2 and 288.8 microns. Pearson correlation was highly significant for these 2 parameters (r= 0.902, p=0.000). CFT was found to be negatively correlated with BCVA but it was not significant (r= -0.39, p=0.427).
Mean values of DRIL in 1 mm and 3 mm zones were 498.44 +/- 103.58 and 1046.64 +/- 144.92 microns. DRIL in 1 mm was found to be significantly correlating with BCVA (r= 0.489, p=0.007), PFT (r= 0.474, p=0.008), DRIL in 3 mm (r=0.926, p=0.000), and FAZ area (r=0.562, p=0.002). DRIL in 3 mm was significantly correlated with BCVA (r= 0.461 p=0.01), PFT (r= 0.346, p=0.045), DRIL in 1 mm (r=0.926, p=0.000), and FAZ area (r=0.644, p=0.000).
Mean FAZ area was 53897.04 +/- 33568.89 pixels. It was significantly correlating with BCVA (p=0.019), DRIL in 1mm and 3 mm (p=0.00). We have found maximum cut-off for FAZ area was 9600 pixels.
Ellipsoid zone and COST were disrupted in 18 eyes and 15 eyes respectively. Cystic spaces were present in 19 eyes.
Discussion
In this retrospective study, we reported novel method of calculating FAZ area in pixels with the Kowa software. Lee et al in 2013 published a study in which they have used ImageJ software for FAZ area measurement. They have used it for calculating FAZ area/ONH ratio and thus units of FAZ area was not mentioned neither the cut-off value.(7) We hypothesized that 9600 pixel is the cut-off value for normal FAZ area.
We found significant correlation between FAZ area and BCVA (p=0.019). Our finding corroborates with the study done by Arend et al. They studiedperifoveal microcirculation in diabetic maculopathy without clinically significant macular edema with scanning laser video-fluorescein angiogram. They found that FAZ (P<0.01) and perifovealintercapillary area (P=0.01) were further enlarged in the diabetics with reduced visual acuity. They reported that FAZ was enlarged by 73% in eyes with decreased VA. (8)
Sim et alalso reported definite link between macular ischemia and visual function; but only in the approximately 15% of patients with moderate to severe DMI. They also found a strong significant association between papillomacular ischemia and VA, independent of the FAZ size. (4)
Similarly, other studies have reported the correlation between FAZ size and VA but none of them accounted for the effects of confounding variables like DRIL and DROL.(7,9)
In our study, DRIL in 1 mm (r= 0.489, p=0.007), DRIL in 3 mm (r= 0.461, p=0.01) and FAZ area (r= 0.418, p=0.019)were found significantly correlating with BCVA in decreasing order. This explains that DRIL is better predictor of BCVA as compared to FAZ area, though not significant. This can be explained by hypothesis proposed by Pelosini et al. They suggested that if edema increases retinal thickness beyond an elastic limit, bipolar axons can snap and cause loss of visual information signaling from photoreceptors to ganglion cells.(10) A strong association between DRIL in 1 mm and VA in eyes with DME is explainable because the GC/IPL, INL, and OPL contain anatomic structures critical for transmission of visual data
Sun et al also reported in their landmark study that DRIL in 1 mm was the most important OCT parameter for predicting visual acuity in patients with DME. But they have not studied DRIL in 3 mm and FAZ area or macular ischemia.(2)
Balaratnasingam et al studied 95 eyes with OCTA and analyzed FAZ area, DRIL and DROL. They reported BCVA was found to have significant correlation with FAZ area, ellipsoid zone and age but not with mean DRIL length in 3mm.(3)This difference may be explained by following reasons: 1. DRIL in 1 mm was not analyzed, 2. Mean DRIL length was quite low as compared to our study. This may be because of different patient profile and status of diabetic control in both studies.
FAZ area was found to having better correlation with DRIL in 3 mm (r=0.644, p=0.000) as compared to DRIL in 1 mm (r=0.562). Balaratnasingam et al also found modest correlation (r=0.3961, p=0.000) of FAZ area with DRIL length in 3 mm.(3) This is further supported by the reports of the study done by Nicholson et al. This study found that DRIL can be used to detect macular capillary non-perfusion in patients with DR. The diagnostic sensitivity was 84.4% and specificity was 100%. They proposed that macular ischemia and an enlarged FAZ might have contributed to DRIL and reduced visual acuity.
Limitations of our study are as following: 1) Because of retrospective design of the study, many patients were excluded for not having complete data. Thus a prospective study is required to confirm our findings 2)Study sample size was small thus results might have skewed.3) Our study group included diabetic patients so results cannot be extrapolated for other retinal vascular diseases. 4) Method of FAZ area measurement is new and no previous study is available to compare and validate values. But results are correlating with previous studies done with OCTA and FFA so it may be a novel method to analyze FAZ. Studies will be required in future to give us the range of normal FAZ area in pixels and also for the comparison with established methods of FAZ area measurement.
Conclusion
DRIL and FAZ area can serve as biomarkers for visual prognosis in diabetic patients. DROL ?Novel method of FAZ area measurement can be used in routine practice.
References
- Scarinci F, Jampol LM, Linsenmeier RA, and Fawzi AA. Association of Diabetic Macular NonperfusionWith Outer Retinal Disruption on Optical Coherence Tomography. JAMA Ophthalmol. 2015;133(9):1036–1044.
- Sun JK, Radwan SH, Soliman AZ, Lammer J, Lin M, Prager SG et al. Neural Retinal Disorganization as a Robust Marker of Visual Acuity in Current and Resolved Diabetic Macular Edema. Diabetes 2015;64:2560–2570.
- BalaratnasingamC, Inoue M, Ahn S, McCann J, Gavazi ED, Yanuzzi LA et al. Visual Acuity Is Correlated with the Area of the Foveal Avascular Zone in Diabetic Retinopathy and Retinal Vein Occlusion. Ophthalmology;123(11):2352–2367.
- Sim DA, Keane PA, Ventura JZ, Fung S, Powner MB, Platteau E et al. The Effects of Macular Ischemia on Visual Acuity in Diabetic Retinopathy. Invest Ophthalmol Vis Sci. 2013;54:2353–2360.
- Sim DA, Keane PA, Fung S, Karampelas M, Sadda SR, Fruttiger M et al. Quantitative Analysis of Diabetic Macular Ischemia Using Optical Coherence Tomography. Invest Ophthalmol Vis Sci. 2014;55:417–423.
- Trichonas G, Kaiser PK. Optical coherence tomography of macular edema. Br J Ophthalmol. 2014;98(suppl 2);ii24-9.
- Lee DH, Kim JT, Jung DW, Joe SG, and Yoon YH. The Relationship between Foveal Ischemia and Spectral Domain Optical Coherence Tomography Findings in Ischemic Diabetic Macular Edema. Invest Ophthalmol Vis Sci. 2013;54:1080–1085.
- Arend O, Wolf S,Harris A,Reim M.The Relationship of Macular Microcirculation to Visual Acuity in Diabetic Patients. Arch Ophthalmol. 1995;113(5):610-614.
- Samara WA, Shahlaee A, Shridhar J, Khan MA, Ho AC and Jason HSU. Quantitative Optical Coherence Tomography Angiography features and visual function in eyes with branch retial vein occlusion. Am J Ophthalmol2016;166:76-83.
- Pelosini L, Hull CC, Boyce JF, McHugh D, Stanford MR, Marshall J. Optical coherence tomography may be used to predict visual acuity in patients with macular edema. Invest Ophthalmol Vis Sci2011;52:2741–2748.
- Nicholson L, Ramu J, Triantafyllopoulou I, Patrao NV, Comyn O, Hykin P et al. Diagnostic accuracy of disorganization of the retinal inner layers in detecting macular capillary non-perfusion in diabetic retinopathy. Clinical and Experimental Ophthalmology 2015; 43: 735–741.
Image 1: Method of FAZ area measurement.
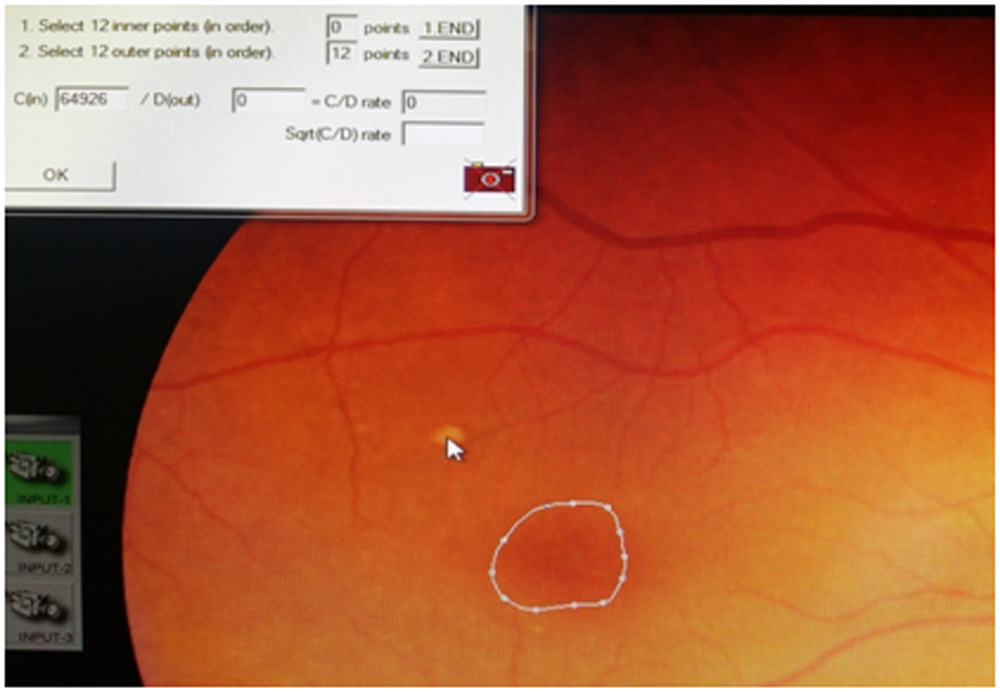
Figure 1: FAZ was marked with 12 points in continuation in angiography photos. Software gives value of that area in pixels. this photograph is used only for demonstration purpose.
Image 2. Method of delineating 1 and 3 mm zones in raster scan
Leave a Comment