
Dr. Smital Mahadeorao Metange, S20228, Dr. Madan Ashok Hukumchand, Dr. Saurabh Agrawal, Dr. Nilesh Gaddewar
Introduction
Glaucoma is characterised by the underlying progressive optic neuropathy (1) which leads to irreversible blindness. By 2020, India will become 2nd overall in number with glaucoma (2) which will have significant health & economic consequences on the developing country. But the fact that glaucoma is preventable & the key to prevention lies in early detection & prompt treatment, warrants further research in this grey zone thus reducing blindness due to glaucoma.
Although visual field analysis has been gold standard for glaucoma diagnosis, it has been documented that 40% of the RNFL maybe lost prior to a defect in the visual fields (3). Thus, RNFL loss precedes visual field defects thereby detecting glaucoma early i.e. pre-perimetric detection.But, as RNFL is not so effective in cases of high myopia where it progressively thins out.The optic neuropathy i.e. the ganglion cell loss is depicted more effectively by GCC as compared to RNFL. The importance & effectiveness of GCC analysis for glaucoma is well documented in many studies (4).
As the ganglion cell layer is thickest at the macula & RNFL increases in thickness towards the disc (5), macular GCC & circumpapillary RNFL were compared in this study which gave their respective best results for the early glaucoma diagnosis. FLV, GLV and quadrant- wise RNFL loss were also studied.
Subjects and Methods
The study was conducted in GMC, Nagpur, a tertiary care centre in the Central India.It was an observational study involving 140 subjects (80 controls and 60 pre- perimetric glaucoma patients) who were in the age group from 18-60 years. The study period was from July 2016-2017. The procedures followed the tenets of the Declaration of Helsinki.
The participants were informed and the consent taken. They were subjected to complete ophthalmic examination which included visual acuity, BCVA, refractive error, slit lamp examination, IOP measurement through Applanation Tonometry, Gonioscopy, Pachymetry, slit lamp biomicroscopy, visual field analysis by perimetry and GCC & RNFL analysis by the Optical Coherence Tomography.
The controls had an IOP <21 mmHg without the optic nerve head changes, RNFL defects and the family history of glaucoma. The pre- perimetric glaucoma patients included patients with IOP >/=21mm Hg with the optic nerve head /RNFL changes without visual field changes. Patients having corneal opacities, high refractive errors, retinal & macular diseases which would have influenced the two important variants of the study, were excluded from the study.
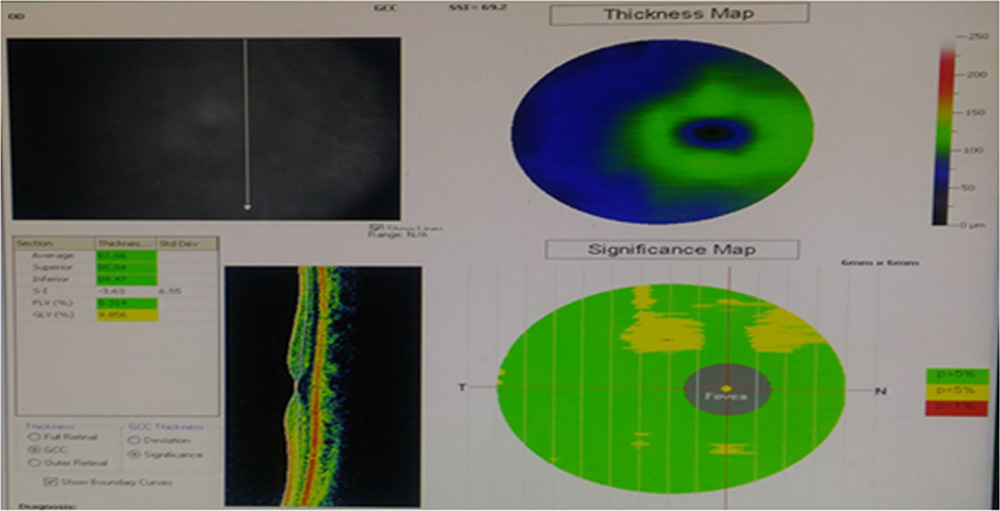
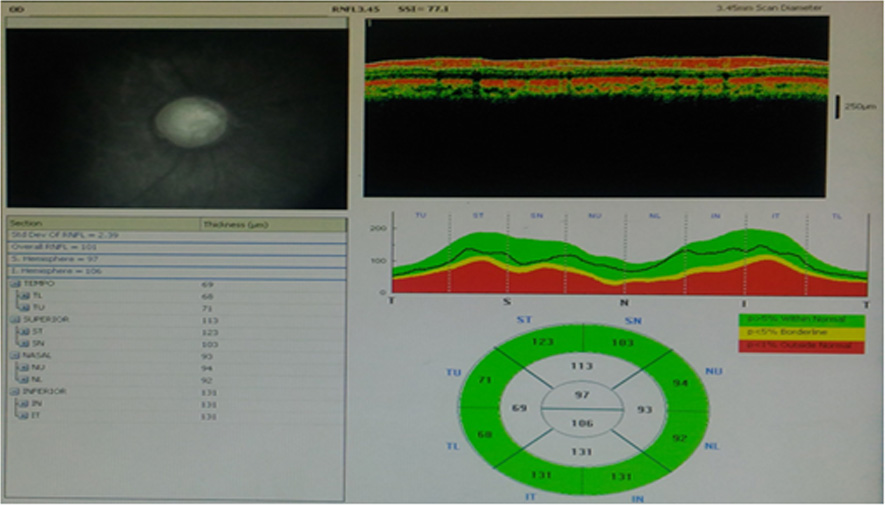
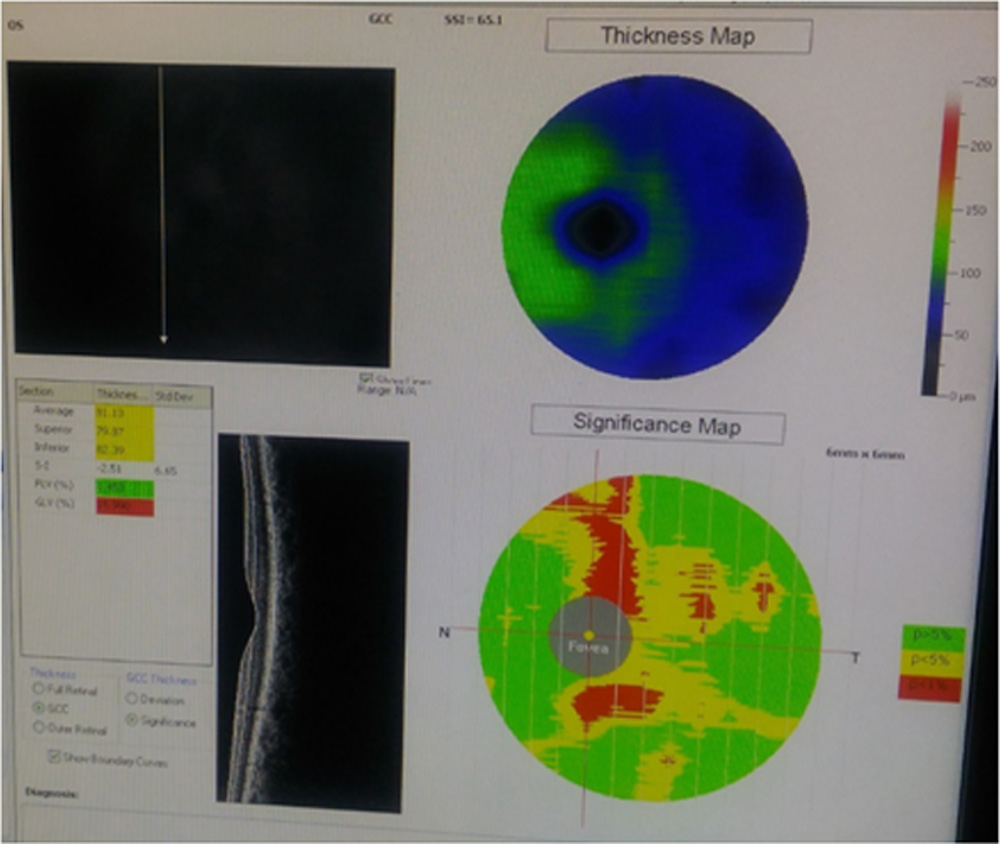
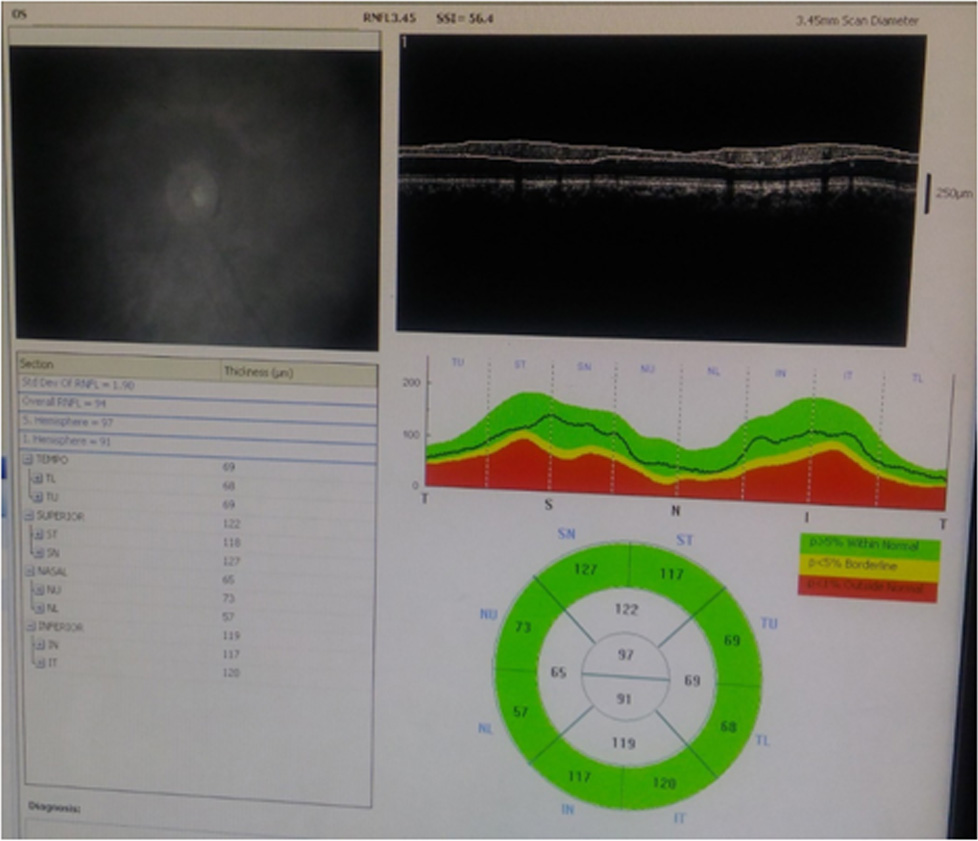
mGCC and cpRNFLmeasurements over OCT-
Spectral domain- OCT (Fourier based Optovue) was performed by a single experienced examiner after dilating the pupil with 0.5%tropicamide eye drops. Internal fixation was achievedand scans were obtained. OCT scans underwent quality check and only those with the signal strength more than 6 were included.
The mGCC scan sampled macula in 0.6 secs to reduce the problems of eye movements and corneal dryness. The scan pattern consisted of 128×512 pixel taken in 6x6mm sq. area. The cpRNFL thickness was calculated in 3.45mm radius ring centred on the optic disc. The global and quandrantmGCC and cpRNFL along with FLV and GLV measurements were obtained from a built- in software.
The data obtained was tabulated in Microsoft Excel. The AUROC curves were obtained and compared using the 17.8 version of Medcalc Software. All other analyses were obtained using the SPSS statistical software.
Results
Out of 140 participants enrolled for the study 60 eyes (participants) were pre-perimetric glaucoma cases and 80 were controls. The mean age of pre- perimetric glaucoma patients was 48 years and that of the controls was 27 years. In the pre- perimetric group 27 were male & 33 were female patients and in the controls there were 41 males & 39 females.
The AUROC depicted the ability of each parameter to discriminate the cases from controls. The comparison of AUROC’s of the average mGCC and the cpRNFL is shown in the figure 1. It shows that the AUROC of mGCC is significantly greater than cpRNFL (P < 0.01).The highest sensitivity and specificity for mGG are 88.33 & 96.25 whereas that for cpRNFL are 76.67 & 77.50. The cpRNFL didn’t detect any of the pre-perimetric glaucomatous eyes that were not detected by mGCC loss.
The data obtained had normal distribution. The differences of means for cpRNFL&mGCC were statistically significant for the controls and pre- perimetric glaucoma groups with the cpRNFL (P < 0.001) and mGCC(P < 0.001).(Table 1)
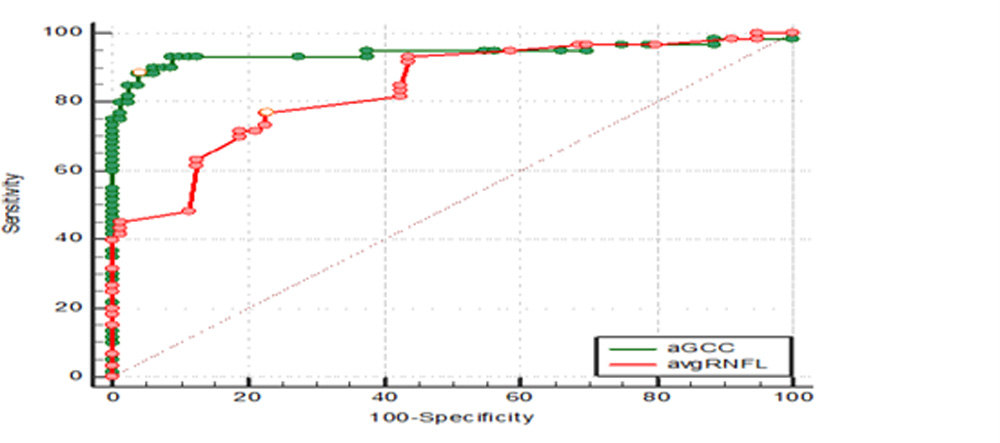
Figure 1. Receiver operating characteristic curve.
Table 1: Comparative OCT data for study group.
| Diagnosis | cpRNFL | mGCC |
| CONTROLS
Mean N Std. deviation 95% CONF interval
|
112.0375 80 8.8209 110.0745 to 114.0005 |
100.4691 80 6.1316 99.1046 to 101.8336 |
| CASES
Mean N Std. deviation 95% CONF interval |
95.1333 60 13.3828 91.6762 to 98.5905 |
84.7305 60 8.6594 82.4935 to 86.9675 |
Table 2: Comparison of diagnostic accuracy of the corresponding thickness parameters using the area under receiver‑operating characteristics curve
| Variable | AUC | SEa | 95% CIb |
| aGCC | 0.944 | 0.0255 | 0.891 to 0.975 |
| avgRNFL | 0.839 | 0.0340 | 0.768 to 0.896 |
a DeLong et al., 1988 b Binomial exact
Table 3: Pairwise comparison of ROC curves
| Avg mGCC ~ Avg cpRNFL | |
| Difference between areas | 0.104 |
| Standard Error a | 0.0404 |
| 95% Confidence Interval | 0.0253 to 0.184 |
| z statistic | 2.586 |
| Significance level | P = 0.0097(i.e.<0.001) |
a DeLong et al., 1988
Table 4: Comparing difference of means of mGCC&cpRNFL between pre-perimetric & control groups
| mGCC | cpRNFL | |
| Difference of means | -16.9042 | -15.7386 |
| Standard error | 1.87949 | 1.25012 |
| 95% CI | -20.62053 to -13.18787 | -18.21046 to -13.26674 |
| DF | 138 | 138 |
| Significance level | P < 0.0001 | P < 0.0001 |
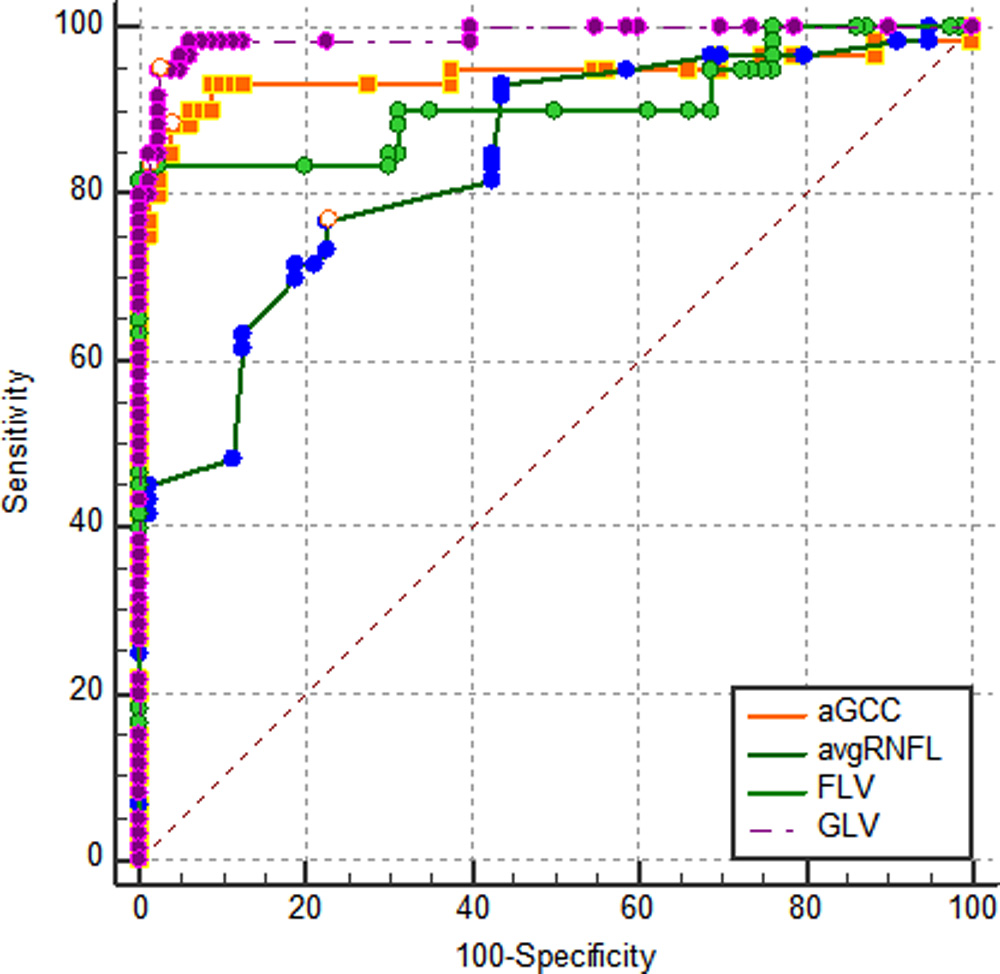
| Variable | AUC | SEa | 95% CIb |
| aGCC | 0.944 | 0.0255 | 0.891 to 0.975 |
| avgRNFL | 0.839 | 0.0340 | 0.768 to 0.896 |
| FLV | 0.907 | 0.0301 | 0.846 to 0.949 |
| GLV | 0.988 | 0.00750 | 0.953 to 0.999 |
Pairwise comparison of ROC curves
| aGCC ~ avgRNFL | |
| Difference between areas | 0.104 |
| Standard Errora | 0.0404 |
| 95% Confidence Interval | 0.0253 to 0.184 |
| z statistic | 2.586 |
| Significance level | P = 0.0097 |
| aGCC ~ FLV | |
| Difference between areas | 0.0369 |
| Standard Errora | 0.0392 |
| 95% Confidence Interval | -0.0399 to 0.114 |
| z statistic | 0.942 |
| Significance level | P = 0.3463 |
| aGCC ~ GLV | |
| Difference between areas | 0.0448 |
| Standard Errora | 0.0242 |
| 95% Confidence Interval | -0.00263 to 0.0922 |
| z statistic | 1.851 |
| Significance level | P = 0.0641 |
| avgRNFL ~ FLV | |
| Difference between areas | 0.0676 |
| Standard Errora | 0.0413 |
| 95% Confidence Interval | -0.0134 to 0.149 |
| z statistic | 1.635 |
| Significance level | P = 0.1020 |
| avgRNFL ~ GLV | |
| Difference between areas | 0.149 |
| Standard Errora | 0.0329 |
| 95% Confidence Interval | 0.0847 to 0.214 |
| z statistic | 4.533 |
| Significance level | P < 0.0001 |
| FLV ~ GLV | |
| Difference between areas | 0.0817 |
| Standard Errora | 0.0284 |
| 95% Confidence Interval | 0.0260 to 0.137 |
| z statistic | 2.878 |
| Significance level | P = 0.0040 |
Conclusion
OCT is increasingly being used in the diagnosis of glaucoma as it gives high resolution imaging of the RNFL, optic nerve head and the macula with the additional advantage of being non- invasive and rapid. RNFL thickness has long being used to detect initial signs of glaucoma development prior to visual field changes. With the advent of GCC imaging in the OCT, GCC analysis has been a supplementary tool for glaucoma evaluation.
But the studies mentioning utility of ERG and GCC imaging in early diagnosis of glaucoma (6) and the knowledge that the GCC is 1st to get affected in glaucoma, it becomes necessary to compare RNFL and GCC for the early detection of glaucoma. In the present study, we found that mGCC and cpRNFL both were reduced in pre- perimetric glaucoma patients, but mGCC appears to detect glaucoma earlier than cpRNFL and is not just supplementary but better than cpRNFL in the early detection of glaucoma.The ability of GCC to detect glaucoma early as compared to RNFL is found to be slightly better in some studies(7 ) but it is still not utilised as the primary modality for the early glaucoma detection. Besides all the pros, the cons are those of the macular diseases like ARMD hindering the usefulness of GCC. The study had limitations as it was a retrospective study, patients couldn’t be followed and there was exclusion of patients having macular diseases, refractive errors and visual field defects.
The study stressed the importance of GCC by stating that mGCC can be primarily and independently be utilised for the early diagnosis and progression of glaucoma
a DeLong et al., 1988
b Binomial exact
a DeLong et al., 1988
Leave a Comment