
Dr. Prashant Keshao Bawankule, B08692, Dr. Shilpi Narnaware
Purpose :To compare anatomic success of PPV after ILM Peel at macular, peri-papillary area & no peel in RRD.
Methods : A retrospective observational study was conducted on 391 eyes of 389 patients with RRD during January 2012 – October 2016. Eyes were grouped into 1 ) PPV with no ILM peel 2) PPV with macular peel 3) PPV with peri-papillary peel. Primary & final success rates were obtained & compared statistically for significance of difference across groups using pearsons chi-square test.Exclusion criteria included previous RD surgery.
Results :Primary success atno peel was 80% (72/90) , at macular was 85.71% ( 174/203) while it was maximum i.e. 94.89% ( 93/98) at peri-papillary area. The difference in primary success across 3 groups was statistically significant with p value of 0.009
Final success was observed in 97.14% cases of no peel followed by 97.52% in macular peel & 100% cases in peri-papillary group. The difference in final success rates across 3 groups was statistically significant with p value of 0.048.
Conclusion :Anatomic success rate of PPV with peri-papillary ILM peel is significantly higher compared to other groups .
INTRODUCTION
Rhegmatogenous retinal detachment (RRD) is the most common vision-threatening retinal condition requiring urgent care [1]. There are three critical pre-conditions for the development of RRD: liquefied vitreous, tractional forces that produce a retinal break, and fluid access into the subretinal space through the retinal break [2, 3].
The aim of RRD treatment is identification and localization of retinal tears and their closure, as well as removing any traction on the edges of the tear [3].
Traction has 3 components : 1) Antero-posterior 2) Circumferential 3) Tangential.
Vitrectomy relieves Anterio-Posterior and Circumferential traction. Encircling band & base excision relieve the circumferential traction. Membrane Peeling relieves the tangential traction on the surface of Retina.
ILM as a cause of tangential traction is well established and is responsible for development of macular hole. Peeling of ILM leads to relief of this traction and thereby increases rate closure of full thickness macular hole [4].
ILM as a cause / role of tangential traction in retinal detachment & PVR and its relief by peeling internal limiting membrane during vitrectomy has not been addressed in any previous study.
Also it is well established that 10-15% cases of vitreous surgery developed epiretinal membrane [5]. The ILM Peel will also avert the need of further procedures for the same.
In our surgical approach, we completed the vitrectomy followed by PVD induction & base excision.None of our patients included in the study period received scleral buckle or encircling band. Additionally in randomly selected patients one group received limited macular ILM peel and in other group Peri-papillary +Macular ILM peel was done.
As age of patient, lens status, duration of detachment, position of break, presence of choroidals&presence of preoperative PVR influence the anatomical outcomes of primary PPV, this retrospective analysis evaluates the influence of these factors on the primary & final anatomical success rate of vitrectomy with ILM Peel for RRD.
Methods
Study design
A retrospective observational study was conducted on 391 eyes of 389 patients with primary RRD during January 2012 – February 2016 by one experienced retinal surgeon.Eyes were grouped into 1) PPV with no ILM peel 2) PPV with macular peel 3) PPV with macular &peri-papillary peel. For the purpose of the study, only patients undergoing vitrectomy in cases of primary RRD were selected. Patients with subtotal or total RRD with a giant retinal tear, retinal dialysis, multiple retinal breaks, posterior breaks, RRD with vitreous haemorrhage and retinal detachments with preoperative PVR (all grades), were included in the study. PVR stage was graded according to the updated classification of Retina Society Terminology Committee (1991) [6].
- Fresh RD : < 28days
- Paediatric RD : < 18 years
- Bare choroid measurement :
Two groups<10DD
>10DD
Excluded from the study were patients with history of trauma, combined detachments, history of any previous retinal surgery & patients with incomplete follow-up period.
Surgical procedure
In all cases, 23 Gauge PPV with Alcon constellation was performed using a noncontact wide-angle viewing system (Oculus BIOM). After receiving informed consent, surgery was performed mostly under local anaesthesia. Trocars were placed in a way that allows peripheral vitrectomy to be performed without touching the lens, and also switching between the 3 entry sites, if necessary.Core vitrectomy was followed by PVD induction. Membranes were peeled. Base excision was done in all cases. No cases received encircling / sclera buckle.The first group did not undergo ILM Peel. In group 2 & 3, ILM was stained with brilliant blue dye. ILM was peeled at macular area in group 2( in between arcades , Diagram 1). In group 3 both macular and peri-papillary area ILM was peeled ( Diagram 2). PFCL was used to flatten the retina & then PFCL –Air exchange was done. Endolaser photocoagulation using curved probe& was applied around the retinal tear & 360° to the vitreous base. All patients received SO (1000 Centistokes) tamponade at the end of the surgery. Patients were examined postoperatively and followed for at least 12 months after the last surgery.
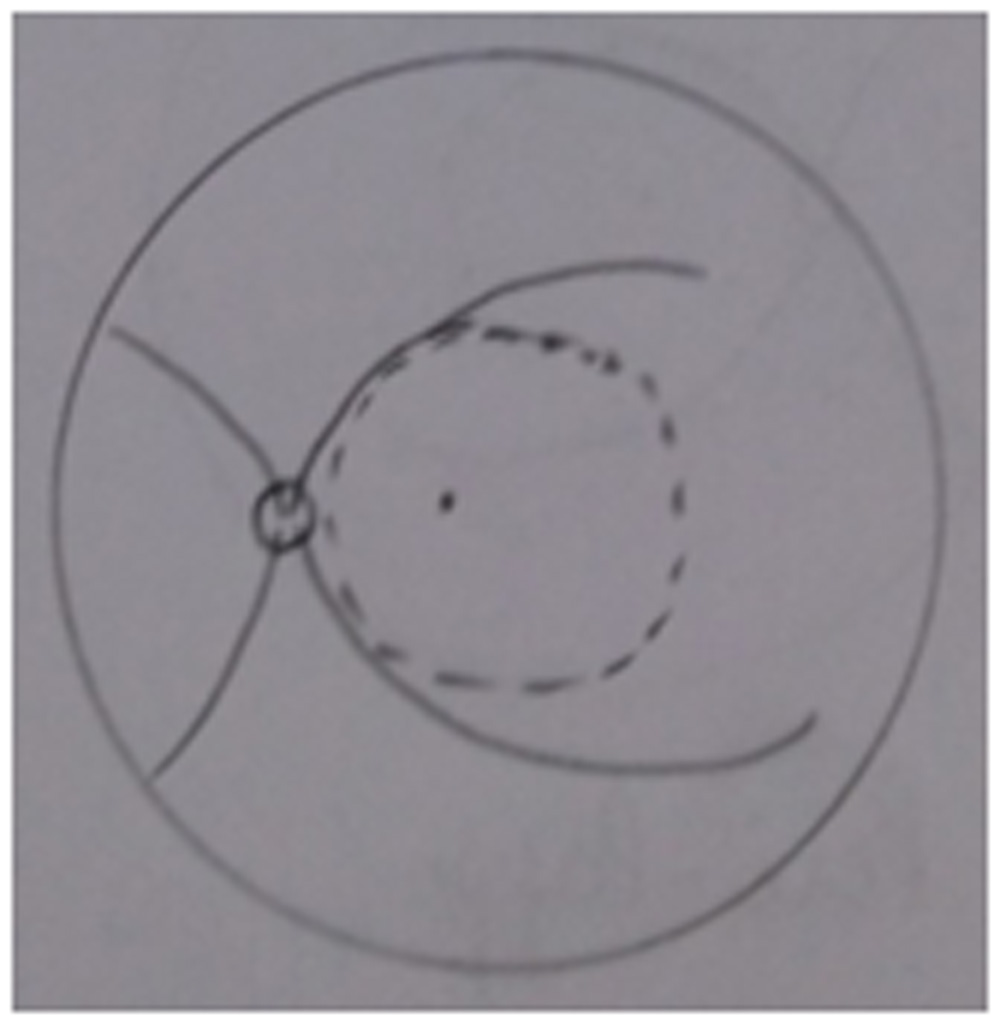
Diagram 1
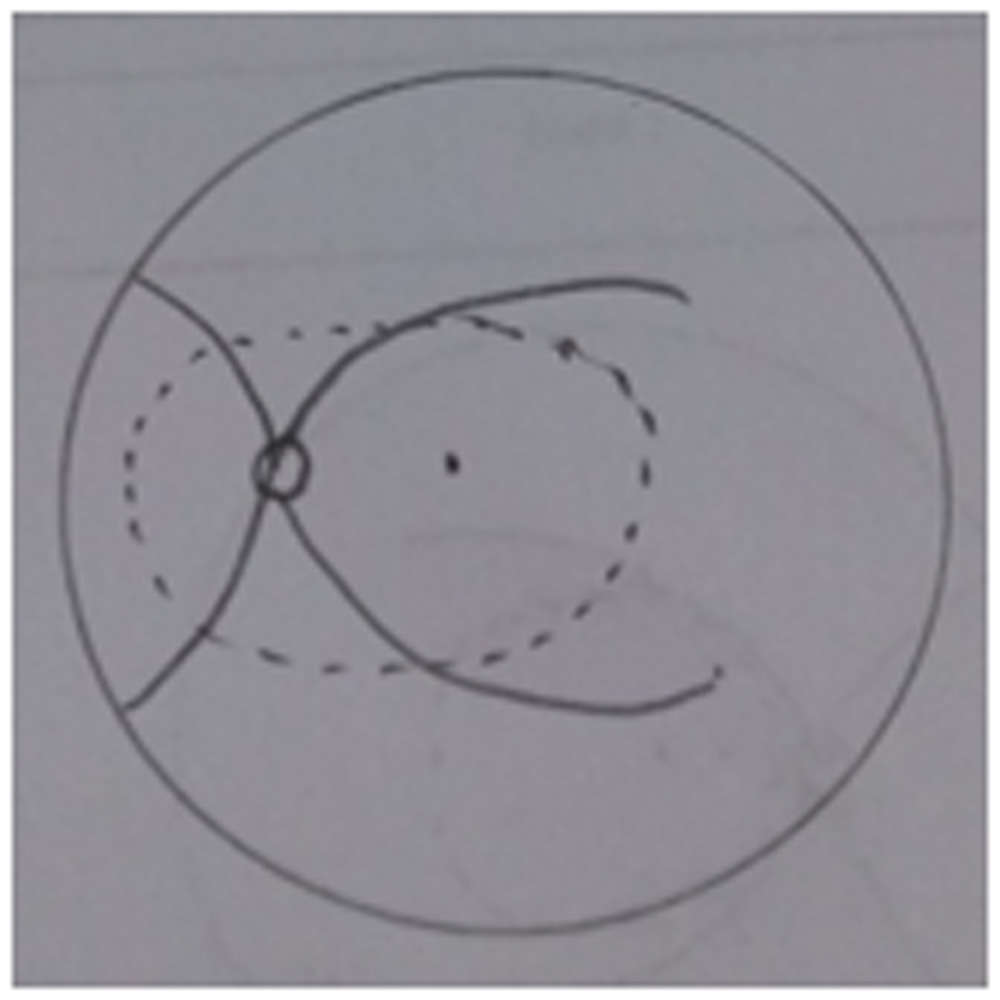
Diagram 2
Statistical methods:
The data on factors like demography, duration of event, lens status, location of break and the exposed choroidal area were obtained on patients undergoing PPV. The patients were observed for a period of one year and the primary, secondary and final success were recorded.
Primary success was considered in cases where retina remained attached at 6 months after removal of silicone oil.
Secondary success was defined as retina remained attached after the last procedure.
Final success is the cumulative of primary and secondary success.
The probability of final success was obtained using following expressions:
P (Final success) = 1 – P (Failure at 2nd surgery)
= 1 – [P (Failure at 1st surgery) * P (Failure at 2nd surgery/Failure at 1st surgery)]
Let n1 be the initial number of patients who underwent surgery for 1st time, and r1 be the number of success in first attempt (primary success). Let n2 be the number of patients undergoing surgery for second time due to recurrence, and r2 be the number of successes in the second attempt. Then the probability of success at second attempt is given by: …(*)
If c1 is number of censored cases after 1st surgery, then n2 is defined as:
n2 = n1 – r1 – c1
Further, recurrence rates were obtained graphically for each factor according to respective levels and procedures using Kaplan-Meier plots. The statistical significance of difference across the three procedures was determined using log-rank test. All the analyses were performed using SPSS version 20.0 (IBM Corp) and statistical significance was evaluated at 5% significance level.
RESULTS
Table 1: Different success rates according to ILM procedure in three groups
| Procedure | Primary success | Second surgery | Secondary success | Final success | P-value (PS) | P-value (FS) |
| No peel (90) | 72 (80.00%) | 14 (15.56%) | 12 (85.71%) | 97.14% | 0.009 (S) | 0.049 (S) |
| Macular (203) | 174 (85.71%) | 23 (11.33%) | 19 (82.61% | 97.43% | ||
| Macular + PP (98) | 93 (94.89%) | 5 (5.1%) | 5 (100%) | 100% | ||
| Total (391) | 339 (87.70%) | 42 (10.74%) | 36 (85.71%) | 98.10% |
P-value obtained using Pearson’s Chi-square test; S: Significant; NS: Non-significant
The primary and final success rates of ILM procedures were obtained as shown in Table 1. As regards primary success, no peel group resulted into 80% success, while macular and macular plus peri-papilary resulted into success rate of 85.71% and 94.89%. The difference in the success rates was statistically significant as indicated by p-value of 0.009. Further, the final success rate in no peel group was 97.14%, while in macular and macular plus peri-papilary, the final success rates were 97.43% and 100% respectively. The difference of between the rates was statistically significant as indicated by p-value of 0.049. The final success was significantly higher in the macular plus peri-papilary group.
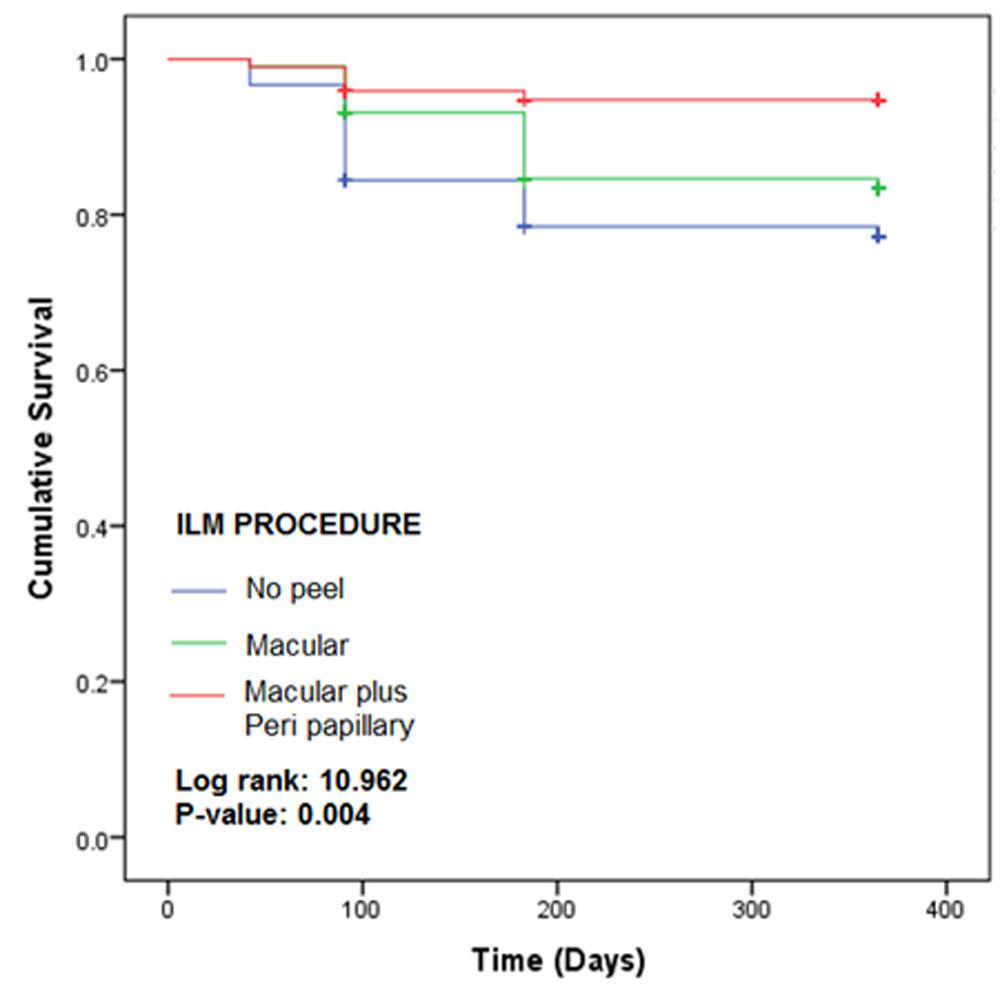
Figure 1: Kaplan-Meier plots for the three study groups
Figure 1 shows the KM plots for no peel, macular and macular plus peri papillary treated groups. The plots indicate the recurrence times for retinal detachment in three groups. It is evident that the difference in the recurrence rates of three groups was statistically significantly different as indicated by p-value of 0.004. The recurrence rate in macular plus peri papillary group was lowest, while that of no peel group was highest.
Table 2:Different success rates according to duration of RD and ILM procedure used
| Duration | Procedure | Primary success | Second surgery | Secondary success | Final success | P-value (PS) | P-value (FS) |
| Old (117) | No peel (31) | 25 (80.64%) | 6 (5.12%) | 5 (83.33%) | 96.77% | 0.253 (NS) | 0.334 (NS) |
| Macular (59) | 46 (77.97%) | 11 (18.64%) | 9 (81.82%) | 95.99% | |||
| Macular + PP (27) | 25 (92.59%) | 2 (7.41%) | 2 (100%) | 100% | |||
| Fresh (274) | No peel (59) | 47 (79.66%) | 8 (13.56%) | 7 (87.5%) | 97.46% | 0.015 (S) | 0.049 (S) |
| Macular (144) | 128 (88.89%) | 12 (8.33%) | 10 (83.33%) | 85.18% | |||
| Macular + PP (71) | 68 (95.77%) | 3 (4.22%) | 3 (100%) | 100% | |||
| P-value | |||||||
| Old vs. Fresh | No peel | 0.999 (NS) | 0.614 (NS) | ||||
| Macular | 0.072(NS) | 0.672 (NS) | |||||
| Macular + PP | 0.899 (NS) | 0.999 (NS) |
z |
P-value obtained using Pearson’s Chi-square test; NS: Non-significant; S: Significant
Table 2 provides success rates according to the duration of retinal detachment and ILM procedure used. In the Old group, amongst 117 treated cases, in the no peel group, primary success rate was 80.64%, while in the macular group, it was 77.97%. The primary success was maximum i.e. 92.59% in the macular plus peri-papillary group. However, the difference in the rates across procedures was statistically insignificant as revealed by p-value of 0.253. The analysis of final success suggested that in the no peel group, the final success rate was 96.77%, while in macular, it was 95.99%. Macular plus peri-papillary group showed 100% final success rate. But the difference of final success rates was statistically insignificant with p-value of 0.334.
On similar lines, analysis was performed for Fresh group. Amongst 274 treated patients, in the no peel category, the primary success achieved was 79.66%, while in the macular group, it was 88.89%, The primary success was maximum i.e. 95.77% in the macular plus peri-papillary group. The success in this group was significantly higher than the other two groups as indicated by p-value of 0.015. Further, the final success rate in the no peel group was 97.46%, while in macular it was 85.18% and macular plus peri-papillary group was 100%. The difference of final success rates across groups was statistically significant with p-value of 0.049.
The comparison of success rates was also performed between durations for each operative procedure. For all the three procedures, the difference of primary success rates between two durations was statistically insignificant (p > 0.05). Similar was the observation for final success rates.
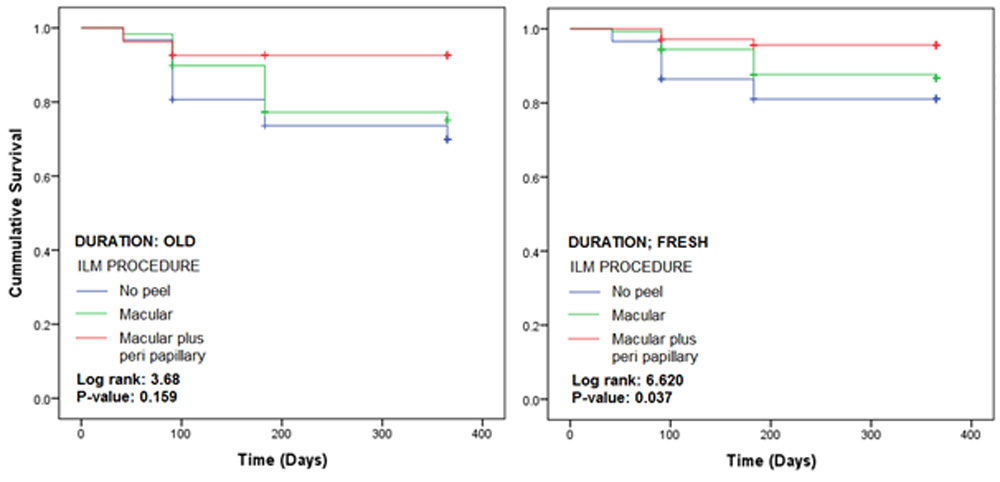 Figure 2: Kaplan-Meier plots according to duration of RD and ILM procedure used
Figure 2 shows the KM plots for three ILM procedures in patients grouped according to duration of retinal detachment. In the OLD group, the recurrence rate in macular plus peri papillary group was lowest, while the no peel group had the highest. However, the difference across the procedures was statistically insignificant with p-value of 0.159. In the FRESH group also, the finding was the same; however, the difference across the recurrence rates was statistically significant with p-value of 0.037.
Table 3: Different success rates according to lens status and ILM procedure used
| IOL | Procedure | Primary success | Second surgery | Secondary success | Final success | P-value (PS) | P-value (FS) |
| Phakic (141) | No peel (39) | 28 (71.79%) | 9 (23.07%) | 7 (77.78%) | 93.73% | 0.043 (S) | 0.026 (S) |
| Macular (64) | 55 (85.94%) | 8 (12.5%) | 8 (100%) | 100.00% | |||
| Macular + PP (38) | 35 (92.11%) | 3 (7.89%) | 3 (100%) | 100.00% | |||
| Pseudophakic (250) | No peel (51) | 44 (86.27%) | 5 (9.80%) | 5 (100%) | 100.00% | 0.071 (NS) | 0.122 (NS) |
| Macular (139) | 119 (85.61%) | 15 (10.79%) | 11 (73.33%) | 96.16% | |||
| Macular + PP (60) | 58 (96.67%) | 2 (3.33%) | 2 (100%) | 100.00% | |||
| P-value | |||||||
| Phakic vs. Pseudophakic | No peel | 0.151 (NS) | 0.443 (NS) | ||||
| Macular | 0.999 (NS) | 0.248 (NS) | |||||
| Macular + PP | 0.597 (NS) | 0.999 (NS) |
P-value obtained using Pearson’s Chi-square test; NS: Non-significant; S: Significant
Table 3 provides different primary and final success rates according to lens status and ILM procedure used. Amongst 141 phakic cases, in the no peel category, the primary success rate was 71.79%, in macular it was 85.94% and in macular plus peri-papillary was 92.11%. The difference of primary success rates across groups was statistically significant with p-value of 0.043. Further, the macular and macular plus peri-papillary had 100% final success rate as compared to no peel with 93.73%. The difference of final success rates was significant with p-value of 0.026.
In the pseudo-phakic group, amongst 250 cases, in the no peel category, 86.27% had primary success, while 85.61% from macular and 96.67% from macular plus peri-papillary had the primary success. The difference in the rates was statistically insignificant with p-value 0.071. Further, the final success rate in the no peel and macular plus peri-papillary categories was 100%, while in macular group was 96.16%. Again, the difference was statistically insignificant with p-value of 0.122.
The comparison of success rates between phakic and pseudo-phakic groups for each ILM procedure revealed statistically insignificant difference of primary success rates (p > 0.05). Similar was the observation for final success rates. In other words, the success rates between two groups were nearly same for different procedures.
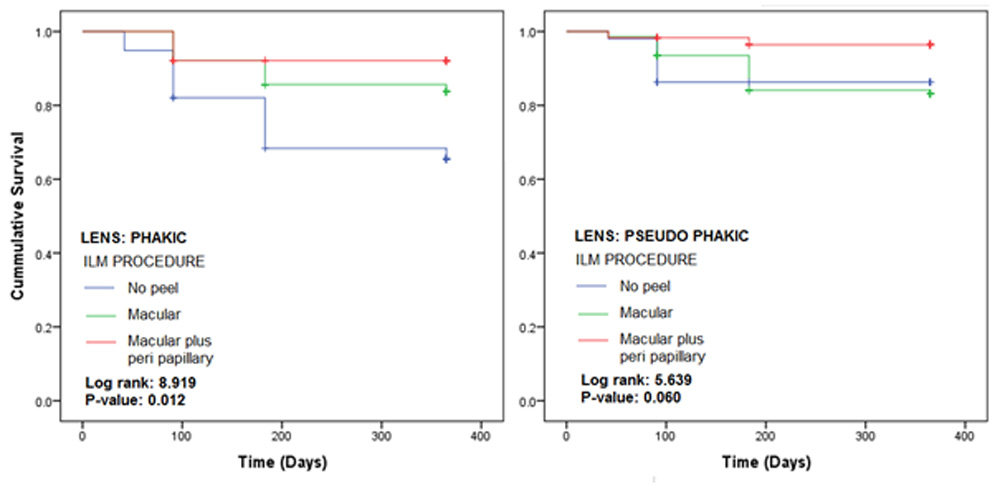
Figure 3: Kaplan-Meier plots according to lens type and ILM procedure used
Figure 3 displays the KM plots for three ILM procedures for patients grouped according to lens types. In the phakic category, macular plus peri papillary treated group showed the lowest recurrence rate, while no peel showed the highest. The difference in the recurrence rates of three groups was statistically significant with p-value of 0.012. The finding in the pseudo phakic group was also the same but the difference in the recurrence rates was statistically insignificant with p-value of 0.06.
Table 4: Different success rates according to quadrant and ILM procedure used
| Quadrant | Procedure | Primary success | Second surgery | Secondary success | Final success | P-value (PS) | P-value (FS) |
| Superior (288) | No peel (68) | 55 (80.88%) | 10 (14.71%) | 8 (80.00%) | 96.17% | 0.033 (S) | 0.095 (NS) |
| Macular (153) | 130 (84.97%) | 19 (12.42%) | 16 (84.21%) | 97.62% | |||
| Macular + PP (67) | 64 (95.52%) | 3 (4.47%) | 3 (100%) | 100.00% | |||
| Inferior (103) | No peel (22) | 17 (77.27%) | 4 (18.18%) | 4 (100%) | 100.00% | 0.209 (NS) | 0.194 (NS) |
| Macular (50) | 44 (88.00%) | 4 (8.00%) | 3 (75.00%) | 97.00% | |||
| Macular + PP (31) | 29 (93.55%) | 2 (6.45%) | 2 (100%) | 100.00% | |||
| P-value | |||||||
| Superior vs. Inferior | No peel | 0.951 (NS) | 0.999 (NS) | ||||
| Macular | 0.765 (NS) | 0.978 (NS) | |||||
| Macular + PP | 0.999 (NS) | 0.999 (NS) |
P-value obtained using Pearson’s Chi-square test; NS: Non-significant; S: Significant
Table 4 gives the primary and final success rates according to quadrant and ILM procedure used. There were 288 cases with involvement of superior quadrant. Amongst these, in the no peel category, the primary success rate obtained was 80.88%, in macular it was 84.97% and in macular plus peri-papillary was 95.52%. The difference in the rates across procedures was statistically significant as revealed by p-value of 0.033. The final success rates were also obtained for each procedure in this group. In the no peel category, it was 96.17%, macular it was 97.62%, while in macular plus peri-papillary, it was 100%. However, the difference in the success rates was statistically insignificant with p-value of 0.095.
Similarly, in the inferior group, in the no peel category, 77.27% patients had primary success, while 88% from macular and 93.55% from macular plus peri-papillary had primary success. The difference in the success rates was statistically insignificant with p-value of 0.209. The final success rates in no peel and macular plus peri-papillary groups were 100%, while that in macular group was 97%. The difference in the rates was statistically insignificant as revealed by p-value of 0.194.
The comparison of success rates between groups for each procedure type revealed statistically insignificant differences of primary and final success rates as indicated by p > 0.05.
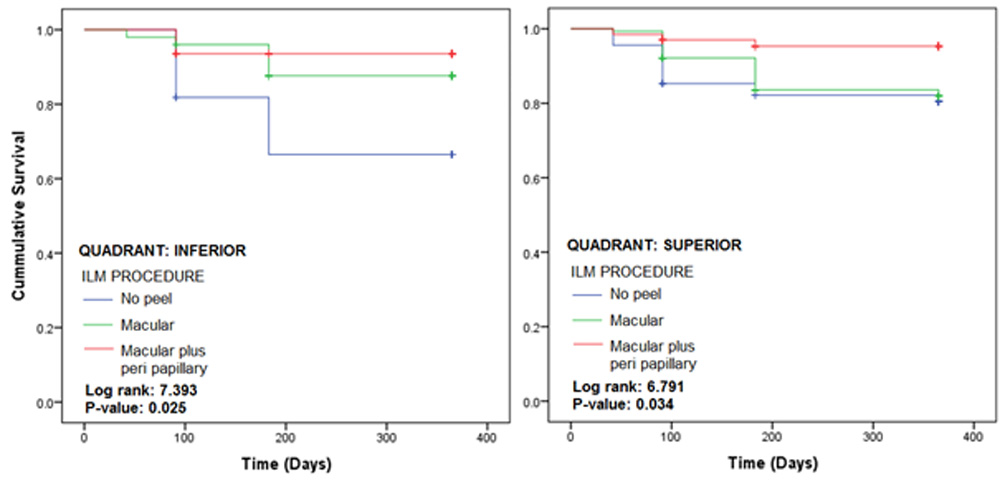
Figure 4: Kaplan-Meier plots according to quadrant and ILM procedure used
Figure 4 provides the KM plots for the three treated groups for patients grouped according to quadrant involved. In the inferior quadrant, again in the macular plus peri papillary treated group, the recurrence rate was lowest, while for no peel group, it was highest. The difference in the recurrence rates was statistically significant as indicated by p-value of 0.025. Similarly, in the superior category, the difference of recurrence rates was significantly different with a p-value of 0.034.
Table 5: Different success rates according to demography and ILM procedure
| Demography | Procedure | Primary success | Second surgery | Secondary success | Final success | P-value (PS) | P-value (FS) |
| Child (21) | No peel (6) | 3 (50%) | 3 (50%) | 3 (100%) | 100.00% | 0.067 (NS) | 0.999 (NS) |
| Macular (9) | 9 (100%) | 0 | 0 | 100.00% | |||
| Macular + PP (6) | 4 (66.67%) | 2 (33.33%) | 2 (100%) | 100.00% | |||
| Adult (370) | No peel (84) | 69 (82.14%) | 11 (13.09%) | 9 (81.82%) | 96.97% | 0.006 (S) | 0.047 (S) |
| Macular (194) | 165 (85.05%) | 23 (11.86%) | 19 (82.61%) | 97.31% | |||
| Macular + PP (92) | 89 (96.74%) | 3 (3.26%) | 3 (100%) | 100.00% | |||
| P-value | |||||||
| Child vs. Adult | No peel | 0.169 (NS) | 0.999 (NS) | ||||
| Macular | 0.444 (NS) | 0.999 (NS) | |||||
| Macular + PP | 0.022 (S) | 0.999 (NS) |
P-value obtained using Pearson’s Chi-square test; S: Significant; NS: Non-significant
Table 5gives the primary and final success rates as per demography (age) and ILM procedure. In the child group (21), the primary success rate for no peel was 50%, while for macular and macular plus peri-papillary, the rates were 100% and 66.67% respectively. However, the difference in the rates across procedures was statistically insignificant with p-value of 0.067. The final success was 100% in all the three groups, which was insignificant (p=0.999). In the adult group, the primary success rate in the no peel category was 82.14%, macular was 85.05% and macular plus peri-papillary was 96.74%. The difference was statistically significant with p-value of 0.006. Further, the final success in no peel group was 96.97%, in macular was 97.31% and 100% in macular plus peri-papillary category. This difference was also noted as statistically significant with p-value of 0.047.
The comparison of primary success between child and adult group for no peel category resulted into insignificant difference. Similar was the observation for macular category (p=0.444); however, for macular plus peri-papillary category, the difference was significant with p-value of 0.022. The final success rates were insignificantly different between child and adult group, irrespective of the procedure used.
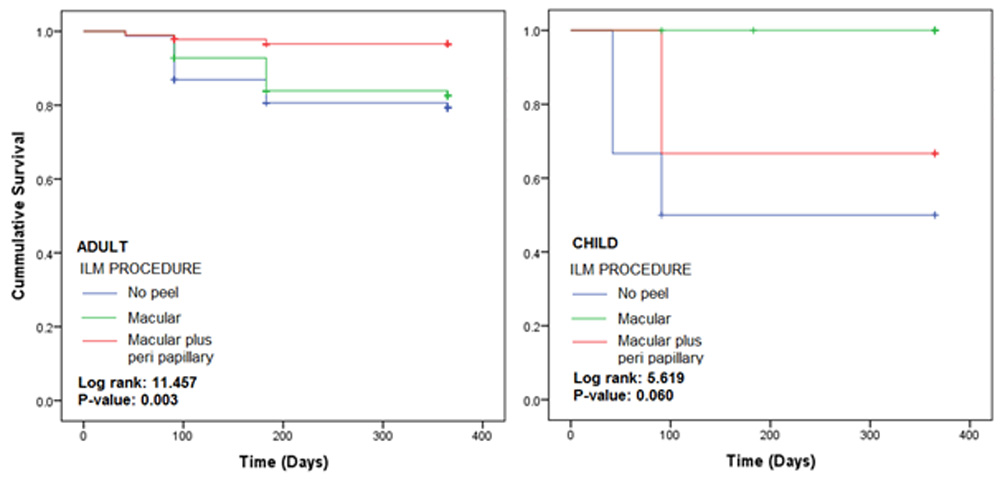
Figure 5: Kaplan-Meier plots according to demography and ILM procedure used
Figure 5 shows the KM plots for ILM treated groups for patients grouped according to age. In adults, the macular plus peri papillary treated group had the lowest recurrence rate, while no peel group had the highest. The difference in the recurrence rate across three treatment modalities in adults was significantly different with p-value of 0.003. However, in the child category, the difference was statistically insignificant with p-value of 0.06.
Table 6: Different success rates according to bare choroid area and ILM procedure used
| Bare choroid area | Procedure | Primary success | Second surgery | Secondary success | Final success | P-value (PS) | P-value (FS) |
| BCA <= 10 (352) | No peel (77) | 65 (84.41%) | 9 (11.69%) | 7 (77.78%) | 96.54% | 0.082 (NS) | 0.062 (NS) |
| Macular (183) | 159 (86.88%) | 21 (11.47%) | 17 (80.95%) | 97.50% | |||
| Macular + PP (92) | 87 (94.56%) | 5 (5.43%) | 5 (100%) | 100.00% | |||
| BCA > 10 (39) | No peel (13) | 7 (53.84%) | 5 (38.46%) | 5 (100%) | 100.00% | 0.104 (NS) | 0.999 (NS) |
| Macular (20) | 15 (75.00%) | 2 (10.00%) | 2 (100.00%) | 100.00% | |||
| Macular + PP (6) | 6 (100%) | 0 (6.45%) | 0 (100%) | 100.00% | |||
| P-value | |||||||
| BCA <= 10 vs. BCA > 10 | No peel | 0.029 (S) | 0.999 (NS) | ||||
| Macular | 0.269 (NS) | 0.099 (NS) | |||||
| Macular + PP | 0.999 (NS) | 0.999 (NS) |
P-value obtained using Pearson’s Chi-square test; NS: Non-significant
Table 6 provides the primary and final success rates according to bare choroid area (BCA) and ILM procedure used. There were 352 cases with BCA less than 10; and amongst these, in the no peel category, the primary success rate was 84.41%, while in the macular category, it was 86.88% and macular plus peri-papillary, it was 94.56%. The difference in the rates across procedures was statistically insignificant with p-value of 0.082. Further, the analysis of final success rates showed that in the no peel category, the success was 96.54%, while in the macular, it was 97.5% and macular plus peri-papillary type, it was 100%. However, the difference in the final success rates across procedures was statistically insignificant with p-value of 0.062.
On similar lines, in the BCA > 10 group, amongst the 39 patients, in the no peel category, primary success was 53.84%, while in the macular and macular plus peri-papillary, the rates were 75% and 100% respectively. The difference of rates across procedure types was statistically insignificant with p-value of 0.104. The final success rate in all the three types was 100% showing insignificant difference across with p-value of 0.999.
The comparison of success between two BCA groups revealed that in the no peel category, the primary success rate in BCA <= 10 was significantly higher than that of BCA > 10 with p-value of 0.029. However, in macular and macular plus peri-papillary categories, the differences were statistically insignificant. The final success rates were also insignificantly different between two BCA groups for all the three procedure types.
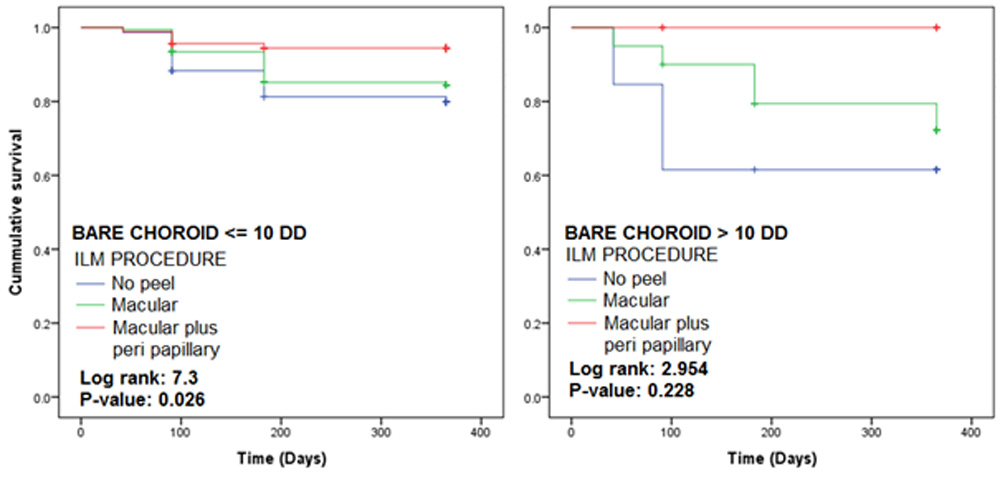
Figure 6: KM plots according to bare choroid area and ILM procedures used
Figure 6 provides the KM plots for ILM procedures for patient groups based on exposed choroid area. In the group with area <= 10 DD, the recurrence rate in macular plus peri papillary category was the lowest, while the rate for no peel was maximum. The difference in the recurrence rates across three procedures was statistically significant with p-value of 0.026. In the group with area more than 10 DD, the observations were similar; however, the recurrence rates differed insignificantly as indicated by p-value of 0.228.
Discussion
Rhegmatogenous retinal detachment (RRD) is the most common vision-threatening retinal condition requiring urgent care. Retinal Detachment surgery has come a long way from scleral buckling to primary vitrectomy. A rapid rise in popularity of primary vitrectomy for RRD has occurred due to the better intraoperative control of complicated RRD and avoidance of complications typically associated with scleral buckles [7.8]. Primary vitrectomy with & without belt buckle show success rate of approx. 87% & 81% respectively [11]. But still the success rate of 100% is eluding us.
The primary success rate for primary vitrectomy in RD indifferent studies have been 78-86% [9]. Our primary success rate in peri-papillary + macular ILM peel was 94.89% & in macular ILM peel was 85.71% compare to no peel ( 80%) & final anatomical success rate was also higher & statistically significant in peri -papillary + macular peel group.
In Old RD, ILM peel showed more success rate in peri -papillary + macular peel group though it was not statistically significant.
The success rate was statistically significant in fresh RD. We feel in fresh RD, as the PVD might be incomplete, & PVR process not mature, perhaps ILM peel might help by ensuring complete PVD & also contributes towards removal of tangential traction.
There are contradictory reports on the success rate in phakic and pseudophakic patients[15-18]
In phakic patients, the difficulties/ inadequacy in base excision (because of fear of lens touch), the success rate is 86-92% [9,11]. This problem could be averted by belt buckle & studies show success rate of 96.3% [10]. In our study, in phakics also the primary & final success rate was 92.11% & 100% respectively in peri -papillary + macular peel group.
A better access to the vitreous base in pseudophakic eyes, allows for a better completion of the recommended complete shaving of the vitreous base compared to phakic eyes [12]. The advances in vitreo retinal instrumentation and wide angle viewing systems along with better understanding has improved our primary and secondary surgical success rate. A reattachment rate of 97.78% from the cases undergoing a single PPV surgery in primary pseudophakic RRD has been observed in series by Stangos et al. [13].While in pseudophakic with belt buckle study revealed primary success rate was 86.7% [11]. In our study, in pseudophakics the primary & final success rate was 96.67% & 100% respectively in peri -papillary + macular peel group.
The success rate in inferior RD (without belt buckle) is lesser than with belt buckle [11] .While in study by L Wickham etal the primary success rate for PPV with belt buckle vs without belt buckle was 89%vs 73% [14]. In our study, none of cases received belt buckle. The primary success rate was 95.52 versus 93.55% in superior versus inferior RD while the final success rate was 100% in both the groups in peri-papillary + macular peel group. Though the primary success difference was statistically insignificant, but for inferior RD it was more than other studies [11,14].
Paediatric RD is a complex RD and its difficult induced complete PVD in such cases & poor success rate in primary vitrectomy is well established. In our study also, like previous studies, we found poor primary success rate in paediatric cases compared to adults.
The primary success rate was 50% in no peel group, 100% in macular peel group and 66.67% in peri -papillary + macular peel group though the final success rate was 100% in all the groups.
Bare choroid (because of breaks / retinotomies) disposes to more PVR, in post operative period and increases the risk of recurrence.
In our study the recurrence rate was 15.59% in no peel group compared to 5.44% in peri -papillary + macular peel group in <10DD of bare choroid while it was 46.16% in no peel group compared to 0% in peri -papillary + macular peel group in > 10 DD.
The ILM peeling even in patients who are exposed to more chances of PVR because of exposed choroid, revealed more success rate compared to no peel.
Conclusions
The success of primary vitrectomy with& without belt buckle is established.
In our study primary vitrectomy without belt buckle & with ILM peel showed better success rate compared to previous studies.
The better success rate with addition of this step into surgical procedure probably helps by:
- Relief of tangential traction
- Ensures completion of PVD
- No substrate for reproliferation at posterior pole
REFERENCES
- Feltgen N, Walter P. Rhegmatogenous retinal detachment – an ophthalmologic emergency. DtschArztebl Int. 2014;111:12–21. [PMC free article] [PubMed]
- Sodhi A, Leung LS, Do DV, Gower EW, Schein OD, Handa JT. Recent trends in the management of rhegmatogenous retinal detachment. SurvOphthalmol. 2008;53:50–67. doi: 10.1016/j.survophthal.2007.10.007. [PubMed] [Cross Ref]
- Kuhn F, Aylward B. Rhegmatogenous retinal detachment: a reappraisal of its pathophysiology and treatment. Ophthalmic Res. 2014;51:15–31. doi: 10.1159/000355077. [PubMed] [Cross Ref]
- Lois N, Burr J, Norrie J et al. Full Thickness Macular Hole & Internal Limiting Membrane Peeling Study ( FILMS) group. Internal Limiting Membrane peeling versus no peeling for idiopathic full thickness macular hole: A pragmatic randomised controlled trial. IOVS 2011;52 (3); 1586-92.
- Moon SooHeo, Hyun Woong Kim, JooEun, Lee, Sang Joon Lee, Il Han Yun et al. Clinical features of macular pucker formation after PPV for primary rhegmatogenous retinal detachment repair. Korean Journal of Ophthalmology 2012.
- Machemer R, Aaberg TM, Freeman HM, Irvine AR, Lean JS, Michels RM. An updated classification of retinal detachment with proliferative vitreoretinopathy. Am J Ophthalmol. 1991;112:159–65. doi: 10.1016/S0002-9394(14)76695-4. [PubMed] [Cross Ref]
- Heimann H, Hellmich M, Bornfeld N, Bartz-Schmidt KU, Hilgers RD, Foerster MH. Scleral buckling versus primary vitrectomy in rhegmatogenous retinal detachment (SPR Study): design issues and implications. SPR Study report no. 1. Graefes Arch ClinExpOphthalmol. 2001;239:567–74. doi: 10.1007/s004170100319. [PubMed] [Cross Ref]
- Ah-Fat FG, Sharma MC, Majid MA, McGalliard JN, Wong D. Trends in vitreoretinal surgery at a tertiary referral centre: 1987 to 1996. Br J Ophthalmol. 1999;83:396–8. doi: 10.1136/bjo.83.4.396.[PMC free article] [PubMed] [Cross Ref]
- 9.YaserHelmy Mohamed, Kozue Ono, Hirofumi Kinoshita, MasafumiUematsu, EikoTsuiki, Azusa Fujikawa, TakashiKitaoka et al. Success rates of vitrectomy in treatment of RRD. Clinical Study , June 2016.
- HamoudaHamdyGhoraba, Adel GalalZaky, Amin Faisal Ellawa et al. Long-term follow up of vitrectomy , with & without 360 degree encircling band for RRD due to inferior breaks. Clinical Ophthalmology ( Auckland, N.Z.)
- Scleral Buckle did not increase efficacy of PPV for RRD .Source : Retina Today 2011/09.
- Teke MY, Balikoglu-Yilmaz M, Yuksekkaya P, Citirik M, Elgin U, Kose T, et al. Surgical outcomes and incidence of retinal redetachment in cases with complicated retinal detachment after silicone oil removal: univariate and multiple risk factors analysis. Retina. 2014;34:1926–38. doi: 10.1097/IAE.0000000000000204. [PubMed] [Cross Ref]
- Stangos AN, Petropoulos IK, Brozou CG, Kapetanios AD, Whatham A, Pournaras CJ. Pars-planavitrectomy alone vsvitrectomy with scleral buckling for primary rhegmatogenouspseudophakic retinal detachment. Am J Ophthalmol. 2004;138:952–8. doi: 10.1016/j.ajo.2004.06.086. [PubMed] [Cross Ref]
- L Wickham, M Connor, G W Aylward et al. Vitrectomy& gas for inferior break retinal detachments : are the results comparable to vitrectomy, gas & scleral buckle. Br J Ophthalmol 2004; 88 : 1376-79.
- Eckardt C. Twin lights: a new chandelier illumination for bimanual surgery. Retina. 2003;23:893–4. doi: 10.1097/00006982-200312000-00039. [PubMed] [Cross Ref]
- Sakaguchi H, Oshima Y, Nishida K, Awh CC. A 29/30-gauge dual-chandelier illumination system for panoramic viewing during microincisionvitrectomy surgery. Retina. 2011;31:1231–3. doi: 10.1097/IAE.0b013e31822091ca. [PubMed] [Cross Ref]
- Chalam KV, Gupta SK, Agarwal S. Illuminated curved vitrectomy probe for vitreoretinal surgery. Ophthalmic Surg Lasers Imaging. 2007;38:525–6. [PubMed]
- Haug SJ, Jumper JM, Johnson RN, McDonald HR, Fu AD.Chandelier-assisted external subretinal fluid drainage in primary scleral buckling for treatment of rhegmatogenous retinal detachment. Retina. 2016;36:203–5. doi: 10.1097/IAE.0000000000000820. [PubMed] [Cross Ref
Leave a Comment