
Dr. Adwaita Nag, N18560, Dr. Subhra Nag, Dr. Asim Kumar Ghosh
Abstract
Title: Choroidal thickness as a predictor of acute or chronic course in Central Serous Chorioretinopathy
Aim: To study if initial subfoveal choroidal thickness (CT) can predict the course of Central Serous Chorioretinopathy (CSC)
Materials and Methods: This was a prospective case series of patients with new onset CSC in a tertiary care centre over 8 months. Subfoveal CT was measured by Enhanced Depth Imaging OCT (EDI-OCT) at first visit. After 3 months of observation, spontaneously resolving cases were defined as acute, rest as chronic.
Results: Out of 42 patients, 18 had acute and 24 had chronic course. Mean CT at presentation was 361.72µ in acute and 425µ in chronic CSC (p<0.05). Out of those with CT>400µ, 15.79% were acute and 84.21% were chronic (p<0.05); for CT<400µ, 65.22% were acute and 34.78% were chronic (p<0.05).
Conclusion: CT may be used to predict the course of CSC, with significantly thicker choroid in chronic cases as compared to acute. Further studies are needed to establish 400µ as the cut-off value of CT for predicting course.
Keywords: Central serous chorioretinopathy (CSC), EDI, OCT, choroidal thickness, subfoveal, predictor, course
Introduction
Central Serous Chorioretinopathy (CSC) is a serous detachment of the neurosensory retina from the Retinal Pigment Epithelium (RPE) at the posterior pole. It is a common, usually unilateral, sporadic and self-limiting condition mostly affecting young or middle-aged males. It is one of the common vision threatening retinopathies after age-related macular degeneration, diabetic retinopathy and branch retinal vein occlusion.[1]
CSC was first described by Albrecht von Graefe[2] in 1866, but the precise pathogenesis and primary site of disease remained controversial for a long time. Today the choroid has been universally accepted as the prime culprit in CSC pathophysiology. Hyperpermeability of the choroid in CSC on fundus fluorescein angiography (FFA) was first reported by Gass, who also coined the term ‘idiopathic central serous choroidopathy’.[3,4] This choroid dysfunction theory has since been seconded by numerous other studies who found choroidal perfusion abnormalities using indocyanine green angiography (ICG-A), laser interferometry and high resolution ultrasonography.[5,6,7] Choroidal imaging underwent a radical change with the advent of Enhanced-Depth Imaging (EDI-OCT), which made it possible to easily obtain detailed high-resolution cross-sectional images of the choroid and also estimate the choroidal thickness.[8]
EDI-OCT is a novel choroidal OCT imaging technique incorporated in the Spectralis (Heidelberg Engineering, Heidelberg, Germany) OCT software that automatically places the RPE near the zero-delay line, producing an upright enhanced choroidal image without the need to manually push the device closer to the eye.[9]A plethora of recent studies have used OCT to measure choroidal thickness and found abnormally thick subfoveal choroid in CSC, reinforcing the theory of a hyperpermeable choroid. The subfoveal choroidal thickness (SFCT) in eyes affected with CSC was proven to be significantly greater than that of unaffected fellow eyes and normal eyes. Moreover, the SFCT in unaffected fellow eye was also larger than that of normal eyes.[10-15]However, it is still unclear whether choroidal thicknessrepresentsthe activity and/or course of CSC.
The course of CSC can either be acute and chronic; they vary in their prognoses. While the acute form can sometimes be recurrent, it generally resolves spontaneously with minimal sequelae. Chronic CSC, however, can result in widespread RPE damage, eventually causing photoreceptor death and severe permanent visual loss. It may be further complicated by cystoid macular edema, foveolar atrophy, subretinal fibrosis or choroidal neovascularization. Definitions of chronicity are arbitrary; earlier, chronic was defined as persistent fluid for > 6 monthswhile recent studies have considered it to be > 3 months.[16-20]
There have not been any dedicated studies that differentiate between acute and chronic CSC on the basis of CT. A few studies report in their ancillary findings that the choroid is thicker in chronic CSC, while some report otherwise.[21-23]Due to these conflicting reports, we felt it was important to better understand the disease and establish whether CT is representative of the course of CSC . Moreover, it would be very useful if CT could be used as an initial tool to predict which CSC patients would or would not resolve spontaneously.
In our case series, we used EDI-OCTto compare the baseline SFCT of acute and chronic CSC. We also attempted to assess the role of SFCT as a novel predictor of the course of CSC.
Materials and methods
This was a prospective observational case series of 42 consecutive patients with new onset CSC who presented atthe Out-Patient Department (OPD) or Retina Research Clinic (RRC) of a tertiary care centre of Eastern Indiafrom May 2016 to December 2016. Follow-up was done from August 2016 to March 2017 while data analysis was done from March 2017 to April 2017. Thestudy was approved by the Institutional Ethics Committee. Written informed consent to participate in the study was taken from each patient after the nature of study had been explained clearly to them. A detailed ocular history was elicited and complete ophthalmological examination done for each patient. Assessment of best corrected visual acuity (BCVA), intraocular pressure (IOP) by Goldmannapplanation tonometry, ocular motility,slit‑lamp examination of anterior segment, fundus examination with 90 D non-contact lens was performed. All patients who were clinically diagnosed with CSC underwent Spectral-domain OCT (SD-OCT) to objectively confirm the diagnosis and also to measure choroidal thickness (CT).
Inclusion criteria
All patients aged between 20-55 years with unilateral treatment-naïve CSC, duration of symptoms 1-2 months and minimum follow-up for 3 months.
Exclusion criteria
Patients with bilateral, chronic or recurrent CSC, any treatment received for CSC, refractive error >1.5D spherical equivalent, high IOP (>21mm of Hg), ocular diseases like uveitis or glaucoma, optic nerve pit, other retino-choroidal diseases or neuro-ophthalmic anomalies were excluded. We also excluded patients in whom OCT images were of poor quality due to unstable fixation or media opacities like dense cataracts or vitreous hemorrhage. Patients with a history of cataract surgery within past 6 months, vitreoretinal surgery or intervention like laser photocoagulation, Photo Dynamic Therapy (PDT) or intravitreal injection were also excluded. Lastly we excluded those patients who were currently taking corticosteroids or retinotoxic drugs like hydroxychloroquine or those with systemic conditions that affect choroidal thickness like diabetes mellitus, uncontrolled hypertension or pregnancy.
EDI-OCT scan
Each patientwas scanned using the Enhanced Depth Imaging (EDI) modeof Spectralis HRA+OCT, Heidelberg Engineering version 6.3.2.0 using the fast macular scan protocol(25 B-scans; 512 A-scans per B-scan; 20⁰x20⁰). All the OCTs were performed under ambient lighting and without pupil dilation to optimize patient comfort. Moreover, all scans and measurements were performed by a single experienced operator to avoid any inter-individual variations. We measured the subfovealCT manually using the caliper tool available in Heidelberg Eye Explorer software version 1.9.10.0. CT was defined as the vertical distance from the hyper-reflective line of Bruch’s membrane to the innermost hyper-reflective line of the chorio-scleral interface. (Figure 1)
Follow-up
After measuring the SFCT at first presentation, all patients were observed for 3 months. 3 months later, all the patients were scanned again to determine if the neurosensory detachment had subsided. Depending on whether the subretinal fluid (SRF) had resolved or not, patients were now classified into two groups respectively – acute and chronic.
Data analysis
Statistical analysis was performed with help of calculators on https://www.socscistatistics.com. The data was expressed as MeanSD (Standard deviation) and represented using tabular and graphic means. One-tailed independent t-test was used to compare means and Fisher’s exact test was used to compare ratios. ROC (receiver operating characteristic) curvewas plotted using a web tool called easyROCversion 1.3 and Youden Index was used to find the cut-off value of SFCT. Sensitivity, Specificity, Positive Predictive Values and Negative Predictive Values were calculated. A p value of p<0.05 was considered statistically significant.
Results
Out of 42 patients, after 3 months of observation, 18 patients (42.86%) had acute CSC and 24 patients (57.14%) had chronic CSC.
Themean age of patients with acute CSC was 34.28± 4.50 years (range 28-44 years) and those with chronic CSC was 37.21± 6.60 years (range 28-52 years).The male to female ratio was 18:0 in acute CSC and 23:1 in chronic CSC. The mean duration of symptoms was27 ± 18.89 daysin acute CSC and 29.17 ± 15.95 daysin chronic CSC. The right eye to left eye ratio (RE:LE) was 9:9 in acute CSC and 14:10 in chronic CSC. The mean IOP was 14.22± 1.80 mmHg in patients with acute CSC and 14.33 ± 2.18 mm Hg in those with chronic CSC.The mean BCVAin the affected eyeat presentation was 0.26 ± 0.14 in acute CSC and 0.34 ± 0.15 in chronic CSC.No significant differences were detected between the two groups on the basis of age,sex ratio, duration of symptoms, laterality, IOP or BCVA.The mean SFCT in acute CSC was 361.72 ± 52.69 µm (range 282-472) while that in chronic CSC was 425 ± 62.79 µm (range 296-543). The initial SFCT at presentation was significantly larger (p<0.05) in patients with persistent fluid after 3 months than in those with self-resolving fluid. (Table 1)
On plotting the ROC curve, we found AUC (area under curve) to be 0.78 and p-value was significant (p<0.05), indicating that the variable being studied, i.e., SFCT, can distinguish well between acute and chronic CSC patients.(Figure 1, Table 2)On using Youden Index, we found an optimal cut-off value of 398µm for chronic CSC. So, a baseline SFCT of >398µm implies a higher probability of chronicity in CSC patients. The sensitivity and specificity are 70.8% and 83.3% respectively while the positive and negative predictive values are 85% and 68.2% respectively. (Table 3) The diagnostic accuracy of SFCT as a predictor was 76.19%.
Discussion
Today, with the advent of new OCT machines and newer software, detailed ultra-high resolution imaging of the choroid has become a reality. The EDI-OCT mode in Spectralisis one of the most favourable modes of visualising the choroidal-scleral junction.[24]
To the best of our knowledge, there has been only one such study till date, that evaluates the role of SFCT as a predictor of the course of CSC. In this recent study, Ambiya et al[25]retrospectively evaluated 33 patients with acute CSC and found a significant correlation between baseline CT and the need for treatment.They reported that the choroid was thinner in those likely to develop chronic CSC. They also suggested a cut-off value, stating that CSC with SFCT≤356 μm is more likely to require treatment.
This was in contrast to the findings of our study. We found that the mean baseline SFCT was significantly more in chronic CSC as compared to acute CSC.We also found a much higher cut-off value of ≥398 µm for persistent non-resolving CSC.Moreover, in comparison, our study was prospective in nature and had a larger sample size.
Our findings were compatible with those of Hamzah et al.They also found a higher SFCT in chronic CSC as compared to acute CSC. Their mean SFCT as 336.6 ± 91.6μm in acute CSC and 388 ± 103.4μm in chronic CSC, with EDI-OCT. With SS-OCT also, the CT in acute CSC was less (332 ± 96.7 μm) than that in chronic CSC (392.6 ± 101.3 μm). However the serous retinal detachment height was more (128.9 ± 83.6 μm) in acute cases than in chronic cases (96.3 ± 62.0 μm).Theyprovided a simple explanation for the thicker choroid in chronic CSC, suggestingthat the extensive RPE damage in chronic CSC leads to more rapid resorption of fluid than in acute CSC, as was proposed by Negi and Marmor[26] in their experimental model.This fluid presumably flows toward the choroid causingmore choroidal thickening in chronic CSC through accumulation of fluid.[21]
Similarly, Marukoet alalso found a higher baseline CT in chronic CSC treated with photodynamic therapy (389±106 μm) as compared to classic CSC treated with laser photocoagulation (345±127µm).[22]
On the other hand, Lee et aldid not find any significant difference between CT of acute CSC (441.6±118.6μm) and chronic CSC (454±166.5μm).[23]
The findings of our study reinforces the fact that subfoveal choroid is thicker in chronic CSC than in acute CSC. Our study also proposes baseline SFCT as a simple screening tool for chronicity in new onset CSC. Keeping in mind the guarded visual prognosis in chronic CSC, it would prove to be invaluable if a simple non-invasive test like OCT can be used to predict the course of CSC. This would not only ensure that patients of chronic CSC get frequent follow-ups but also treatment can be commenced earlier if required. This may also serve as an objective reassurance to patients with acute CSC, who are often not satisfied with simple observation.
Our study has certain limitations, most important being the small sample size and the manual measurement of SFCT. Automatic detection and segmentation systems for CT are not yet commercially available on the Heidelberg Spectralis SD-OCT. Moreover, the follow-up period was only of 3 months. This may have resulted in incorrect classification of some cases as chronic, which would eventually have spontaneously resolved with some more time. Also, since the sample population in this study was limited to Eastern India, regional variations of choroidal thickness may come into play in other areas. Larger multicentre studies with longer follow-up periods are required to establish the precise role of SFCT as a predictor of the course of CSC.
Conclusion
Baseline SFCT on OCT can be used as a novel predictor of the course of CSC with a value ≥ 398µm indicating a risk of chronicity.
References
- Wang M, Munch IC, Hasler PW, Prünte C, Larsen M. Central serous chorioretinopathy. ActaOphthalmol (Copenh). 2008;86(2):126-145.
- Von Graefe A. KurzereAbhandlungen. Notizen und casaistischeMitheilungenvermischtenInhalts: VI. Ueberzentralerecidivirende Retinitis. Albrecht Von Graefes Arch KlinExpOphthalmol 1866;12:211–215.
- Gass JD. Specific diseases causing disciform macular detachment. Stereoscopic Atlas of Macular Diseases 1997;1:52–70.
- Gass JD: Pathogenesis of disciform detachment of the neuroepithelium. Am J Ophthalmol 1967;63(suppl):1–139.
- Guyer DR, Yannuzzi LA, Slakter JS, Sorenson JA, Allen H, Orlock D. Digital indocyanine-green videoangiography of central serous chorioretinopathy. Arch Ophthalmol 1994;112:1057-1062.
- Tittl M, Polska E, Kircher K, Kruger A, Maar N, Stur M et al. Topical fundus pulsation measurements in patients with active central serous chorioretinopathy. Arch Ophthalmol 2003;121:975–978.
- DoroD,VisentinS,Maimone PE,PilottoE.High-resolutionultrasonography incentral serous chorioretinopathy. Am J Ophthalmol. 2005;139:550–552.
- Spaide RF, Koizumi H, Pozzoni MC. Enhanced depth imaging spectral-domain optical coherence tomography. Am J Ophthalmol. 2008 Oct;146(4):496-500.
- Wu L, Alpizar-Alvarez N. Choroidal imaging by spectral domain-optical coherence tomography. Taiwan Journal of Ophthalmology. 2013;3:3-13.
- Imamura Y, Fujiwara T, Margolis R, Spaide RF. Enhanced depth imaging optical coherence tomography of the choroid in central serous chorioretinopathy. Retina. 2009 Nov-Dec;29(10):1469-73.
- Kim SW, Oh J, Kwon SS, Yoo J, Huh K. Comparison of choroidal thickness among patients with healthy eyes, early age‑related maculopathy, neovascular age‑related macular degeneration, central serous chorioretinopathy, and polypoidal choroidal vasculopathy. Retina. 2011;31:1904‑
- Maruko I, Iida T, Sugano Y, Ojima A, Sekiryu T. Subfoveal choroidal thickness in fellow eyes of patients with central serous chorioretinopathy. 2011 Sep;31(8):1603-8.
- Kim YT, Kang SW, Bai KH. Choroidal thickness in both eyes of patients with unilaterally active central serous chorioretinopathy. Eye (Lond). 2011;25(12):1635–40.
- Goktas A. Correlation of subretinal fluid volume with choroidal thickness and macular volume in acute central serous chorioretinopathy. Eye. 2014;28:1431–1436.
- Arora S, Pyare R, Sridharan P, Arora T, Thakar M, Ghosh B. Choroidal thickness evaluation of healthy eyes, central serous chorioretinopathy, and fellow eyes using spectral domain optical coherence tomography in Indian population. Indian J Ophthalmol. 2016;64:747-51.
- Yannuzzi LA. Central serous chorioretinopathy: a personal perspective. Am J Ophthalmol 2010;149(3):361-363.
- Eandi CM, Ober M, Iranmanesh R, Peiretti E, Yannuzzi LA. Acute central serous chorioretinopathy and fundus autofluorescence. Retina. 2005;25:989–993.
- Chan WM, Lai TY, Lai RY, Tang EW, Liu DT, Lam DS. Safety enhanced photodynamic therapy for chronic central serous chorioretinopathy: one-year results of a prospective study. Retina. 2008;28(1):85-93.
- Reibaldi M, Cardascia N, Longo A, Furino C, Avitabile T, Faro S, Sanfilippo M, Russo A, Uva MG, Munno F, Cannemi V, Zagari M, Boscia F. Standard-fluence versus low-fluence photodynamic therapy in chronic central serous chorioretinopathy: a nonrandomized clinical trial. Am J Ophthalmol. 2010;149(2):307-315.
- Shin JY, Woo SJ, Yu HG, Park KH. Comparison of efficacy and safety between half-fluence and full-fluence photodynamic therapy for chronic central serous chorioretinopathy. Retina. 2011;31(1):119-26.
- Hamzah F, Shinojima A, Mori R, Yuzawa M. Choroidal thickness measurement by enhanced depth imaging and swept-source optical coherence tomography in central serous chorioretinopathy. BMC Ophthalmology. 2014;14:145.
- Maruko I, Iida T, Sugano Y, et al. Subfoveal choroidal thickness after treatment of central serous chorioretinopathy. Ophthalmology. 2010;117:1792-1799.
- Lee SH, Chung H, Kim HC. Subfoveal choroidal thickness in fellow eyes of patients with central serous chorioretinopathy. J Korean Ophthalmol Soc. 2012;53(7):982-987.
- Lin P, Mettu PS, Pomerleau DL, Chiu SJ, Maldonado R. Image inversion spectral-domain optical coherence tomography optimizes choroidal thickness and detail through improved contrast. Investigative Ophthalmology & Visual Science. 2012;53(4):1874-1882.
- Ambiya V, Yogi R, Li A, Shah S, Sarvaiya C, Mehta P, et al. Subfoveal choroidal thickness as a predictor of central serous chorioretinopathy. Eye. 2016;30:1623–1629.
- Negi A, Marmor MF: Experimental serous retinal detachment and focal pigment epithelial damage. Arch Ophthalmol. 1984;102:445-449.
Table 1: Demographic characteristics and mean SFCT of patients with acute and chronic CSC
| Characteristics | Acute CSC
(n=18) |
Chronic CSC
(n=24) |
p-value |
| Age (years) | 34.28±4.50 | 37.21±6.60 | 0.06 |
| Male:Female | 18:0 | 23:1 | 1.00 |
| Duration of symptoms (days) | 27±18.89 | 29.17±15.95 | 0.34 |
| RE:LE | 9:9 | 14:10 | 0.76 |
| IOP (mm Hg) | 14.22±1.80 | 14.33±2.18 | 0.43 |
| BCVA (LogMAR) | 0.26±0.14 | 0.34±0.15 | 0.05 |
| Baseline SFCT (µm) | 361.72 ± 52.69 | 425 ± 62.79 | 0.000655 |
Table 2: Analysis of ROC curve
| Marker | AUC | SE AUC | Lower limit | Upper limit | z | p-value |
| SFCT | 0.77778 | 0.07393 | 0.63288 | 0.92268 | 3.75737 | 0.00017 |
Abbreviations: AUC (area under curve), SE (standard error)
Table 3: Performance measures with optimal cut-off value of SFCT (398µm)
| Value | Lower limit | Upper limit | |
| Sensitivity | 0.708 | 0.489 | 0.874 |
| Specificity | 0.833 | 0.586 | 0.964 |
| Positive Predictive Value | 0.850 | 0.616 | 0.942
|
| Negative Predictive Value | 0.682 | 0.458 | 0.920
|
| Positive Likelihood Ratio | 4.250 | 1.466 | 12.321
|
| Negative Likelihood Ratio | 0.350 | 0.181 | 0.675
|
Figure 1: EDI-OCT and choroidal thickness measurement on Heidelberg Spectralis
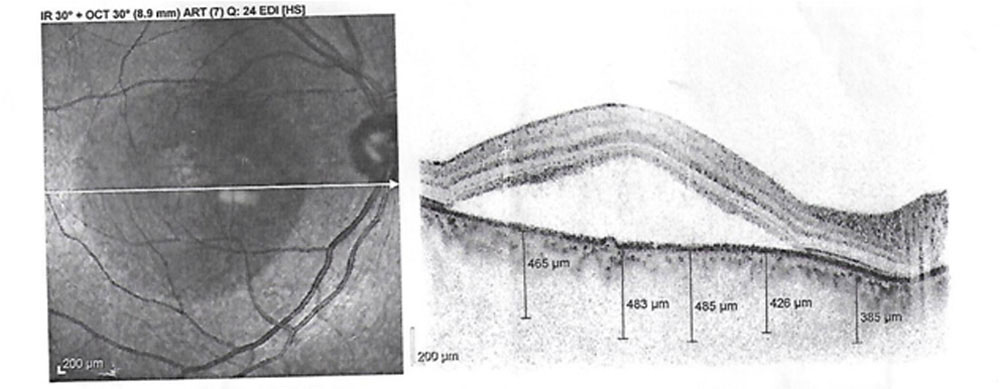
Figure 2: Receiver Operating Characteristic (ROC) curve plot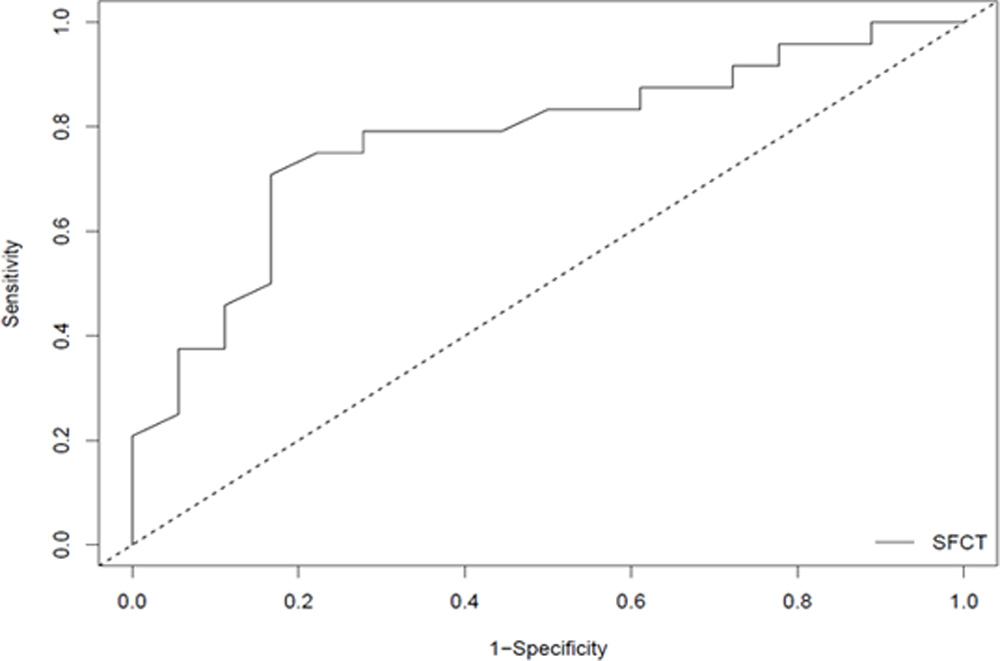
Leave a Comment