
Dr. Puja Maitra, P19231, Dr. Dhivya
Abstract
PURPOSE :To studyepiretinal membrane(ERM) profile on spectral-domain optical coherence tomography(SDOCT) in patients with uveitis
METHODS: Prospective observational study of34 uveitic eyes of 25 patients with SDOCT documented ERM that were followed up for visual acuity(BCVA) and SDOCT changes for 1 year. SDOCT parameters of ERM (thickness at fovea, maximum thickness and location of maximum thickness in relation to fovea) were noted. Changes in type of ERM attachment (focal /global/mixed) were analysed.Changes in altered foveal contour and cystoid macular edema were also noted. BCVA was noted when the inflammation subsided and it was correlated to specific ERM characteristics. SDOCT characteristics were compared in 3 treatment groups (no oral steroids, oral steroids with and without immunomodulators)
RESULTS: Mean logMAR BCVA decreased from 0.25 to 0.35(p=0.005). Foveal involvement with ERM (P=0.011), lost foveal contour(p=0.043), IS-OS disruption (p=0.017) were associated significantly with reduced BCVA. Focal attachment of ERM was more commonly associated with CME (p 0.03).Median ERM thickness showed significant increase(p<0.001). Significant ERM progression from parafoveal to foveal (p=0.02), significant progression of the thickest area of ERM closer to fovea(p=0.0006) indicated a strong tendency of foveal involvement and this was correlated with worse BCVA (p=0.009, r=-0.44) Oral steroids/immunomodulators showed no significant benefit on ERM progession.
CONCLUSIONS: ERM progression in uveitis has a tendency to involve the fovea and is associated with significant vision loss, particularly in foveal ERM ,focal attachment and ISOS disruption.Oral steroids and immunomodulators have no role in haulting progression.
Introduction
Epiretinal membrane (ERM) develops frequently in patients with uveitis and contributes to distance and near vision impairment, metamorphopsia, micropsia, and occasional monocular diplopia. [1,2,3] Although ERMs are usually detected by fundus evaluation, detection sensitivity has been increased by the use of optical coherence tomography (OCT).[4] Among various OCT technologies, spectral-domain (SD) OCT allows better visualization and improved ultrastructural evaluation of the pathological features of ERM and the underlying retinal changes. An earlier study reported mean thickness of ERM as 61 ±28 microns 4, which is quite a wide range, however with SDOCT even thinner ERMs can be studied , generally in the range of 5- to 7µ. Although morphological SD-OCT parameters have been correlated with visual prognosis in patients involved with idiopathic ERM,such observations have not extended to uveitic ERMs. [5-10] This study analyses the correlation of various characteristics of ERM secondary to uveitis with visual acuity, progression pattern and the role of oral steroids and immunomodulators in the natural course of ERM progression
Methods
In this prospective, observational study, uveitic patients presenting between June 2015 to May 2017 were included. Prior institutional review board approval was obtained and written informed consent forms were taken from parents. The study adhered to the tenets of the Declaration of Helsinki. Patients older than 18 years, showing SDOCT supported diagnosis of ERM with either active uveitis on treatment or history of uveitis were included. Patients with coexisting retinal conditions, traumatic uveitis, prior eventful intraocular surgery ,documented ERM before onset of uveitis or any other non-uveitic pathology contributing to formation of ERM were excluded. Patients with dense cataract, non dilation pupil,thick posterior capsular opacification, corneal opacity and uncooperative patients were excludeddue to poor-quality SD-OCT images that prevented evaluation and quantification of the SD-OCT data and patients who underwent cataract surgery within this 12 months were also excluded. Clinical data was collected at the baseline visit at the time of clinical diagnosis of ERM and at visits at baseline- 12 months follow up. The collected information included age, sex, anatomical and clinical diagnosis, symptoms duration of the uveitis, best corrected visual acuity(BCVA), and detailed ophthalmological evaluation, treatment history. Retrospective analysis of severity of previous episodes of uveitis was done. Standardization for Uveitis Nomenclature(SUN) Working Group guidelines were used for uveitis anatomic classification and inflammation grading and activity. Visual acuity was recorded at baseline and follow up visits only when the eye was quiet or severity of residual inflammation was not deemed to be contributory to the decreased visual acuity and there were no other complications like complicated cataract or cystoid macular edema.
All cases underwent SD-OCT [Cirrus 5000 HD-OCT (Carl Zeiss Meditec, Dublin, California, USA)] and 6x6mm area was scanned with raster pattern and were interpreted by single examiner. The measurement were quantified by the built in automated callipers. ERM was diagnosed exclusively on SDOCT findings: hyperreflective signal at inner retinal surface and evidence of contractility including any distortion, corrugation or foveal contour .
ERM – ERM Location (foveal/ parafoveal),central ERM thickness (microns), maximum ERM thickness (microns)and location of maximum thickness (microns from fovea) were recorded at baseline and 12 months follow up. In eyes with apparent tight adherence of the ERM to the inner retinal surface without areas of clear separation of the ERM, the ILM was included as the outer ERM surface. The central circle with a diameter of 1000 µ centred on foveal centre was defined as the foveal area. The middle circle with a diameter of 3000 µ was defined as foveal plus parafoveal area, and the areas encompassed in the larger circle with a diameter of 6000 µ was defined as the entire macular area.
The attachment pattern of ERM to inner retinal layer was classified as focal, global or mixed. (Figure1).[11] ERM was labelled as focal when there were presence of clear spaces in between pinpoint attachment of ERM to inner retinal surface within the central 500µ(Figure 1a, 1b) and global (Figure 1c,1d) where there was near absence of the same. Mixed (Figure 1e) ERM where both the types were present in about a 50-50 ratio.
- Central subfield thickness (CST)- defined as the average retinal thickness in the area enclosed in a 1000µ diameter circle centred at the centre of fovea. The CST at baseline and,12 months was recorded for all eyes that were scanned.
- Visual acuity- At 6 and 12 months follow-up visual acuity and OCT details were recorded when inflammation was under control.
- Treatment modalities- Management of uveitis was based on therapeutic approaches encompassing specific treatment for the underlying systemic condition combined with topical and systemic corticosteroids. Immunomodulatory agents were added if intraocular inflammation was not controlled by corticosteroids and as corticosteroids-sparing agents. Treatment approaches were aimed at zero intraocular inflammation.
Statistics
Statistical analysis was done using non parametric tests and SPSS software (version 20.0). Continuous data was analysed using Chi-square test and Kruksal wallis test. For analysis of serial changes, Wilcoxon signed rank test was used. Mann Whitney U test was used for comparison of non- continuous / ordinal data. Linear regression analysis with calculation of Spearman Correlation was done for identifying ERM characteristics associated with poor visual outcome.
Results
Thirty four eyes of 25 patients were included in the study. Mean patient age was 41.4years (range 26 to70 years). Eleven(44%) patients were male and 14( 66%) were females . Fifteen eyes (44%) had anterior uveitis, 7(21%) intermediate, 2 posterior (6%) uveitis , 9 (26%) panuveitis and 1 ( 3%) sclerouveitis. Uveitis was idiopathic in 12(35%) eyes, while 8 eyes(24%) had VKH, 5 (15%) HLA B27 associated uveitis, 4 (12%) TB associated uveitis and 5 (14%) had other causes including RA factor associated uveitis and Fuchs heterochromic iridocyclitis. Nine (36%) patients had bilateral ERM while 16 had unilateral ERM
Median duration of uveitis before OCT diagnosis of ERM was 12 months (mean 18 ± 15 months, range 3-60). It was 23 months for anterior, 10 months for intermediate and 8 months for posterior uveitis.
SD OCT characteristics
At presentation, 65% eyes had foveal ERM and 35 % had parafoveal ERM, while at the end of 1 year, 88% were foveal and 22 % remained parafoveal. Eight eyes progressed from parafoveal to foveal in 1 year follow up (Table 1). The median ERM thickness at fovea and the median maximum ERM thickness showed a statistically significant increase at 1 year follow up compared to baseline (p value <0.001 each)(Table 1). The median distance of point of maximum thickness from fovea also showed a significant decrease at 1 year follow up(Table1)
Compared to baseline, 8 eyes(24%) developedcystoid macular edema with ERM (p=0.038), Foveal contour was lost in an 15(44 %) eyes (p<0.001)and Ten eyes (29.4%) developed IS-OS disruption in 1 year follow up. (p=0.0006).
The mean CFT changed from 274µ±44 to303 ± 47µ (p<0.001) in 1 year. CME was more commonly associated with presence of focal attachment of ERM at macula with or without combined global attachment [11 of 17 eyes(65%)] vs global attachment alone [4 of 17 eyes (24%)] (p 0.03). Altered foveal contour due to ERM was not significanty associated withCME (p=0.22)
Foveal involvement with ERM, lost foveal contour, and IS-OS disruption was associated significantly with reduced visual acuity. [(R=-0.44, P=0.009),(R=0.35, P=0.04), (R=-0.41, p= 0.01) respectively] (Table 2).Focal attachment of ERM with or withour global attachment had significantly worse vusual acuity (p=0.44) but on linear regression analysis did not show significance(Table 2).
There was no significant difference in change in median ERM thickness at fovea and median maximum ERM thickness in patients treated without oral steroids vs those treated with oral steroids with or without immunomodulators (Table 3).
Visual acuity :
The mean logMAR distance visual acuity worsened from 0.25±0.21 to 0.35± 0.23 (p=0.005) by one year follow up. All patients had N8 or better near vision at baseline. At 6 months follow up 18 % patients dropped below N8, and at 1 year follow up 47% had near vision worse than N8 (p=0.0001). Five(20%) patients had significant metamorphopsia to start with and at the end of 1 year follow up 80 % had metamorphopsia disturbing their daily activities. (Table 4) There was significant correlation between movement of ERM towards fovea and visual acuity (Table 2)
Discussion:
Spectral domain optical coherence tomography (SDOCT) is the best tool for study of ERM as it has an axial resolution of 5-7 microns. It can be used as a tool for detection and follow up of ERM and helps us in morphometric analysis of ERM. ERM formation is a known complication of ocular inflammation and uveits patients may have poor visual acuity due to ERM even after inflammation control.
ERM formation was observed to appear earlier in posterior and intermediate uveitis as expected due closer proximity of the inflammation to the retina.
ERM attachment: 32% of the uveitic eyes with ERM in our study showed a focal pattern of attachment to the underlying retina at 1 year. The focal pattern results in a more corrugated contour of the underlying retina. ERMs with broad attachment (50%), exhibited less retinal surface distortion and fewer visual consequences. A previous study by Nazari et al observed 50% of uveitic ERMs to be focal and reported focal attachment of ERM was an independent factor associated with a less favourable visual acuity in patients with uveitis.[11] Mori and associates also showed that approximately half of the patients with non-idiopathic ERM also have a focal attachment pattern to the retina. [12] The prognostic importance of focal attachment of non uveitic ERM to the retina has been addressed before. Focal ERM is associated with lower visual acuity in patients with uveitis as well. [13]
In our study Global ERMs showed more tendency to progress to focal type or developed a focal component. This could be due tothe presence of histological components like – myofibroblasts, fibroblasts, lymphocytes, and occasional macrophages in the ERMsas well as associated inflammatory cytokines can lead to contraction of the ERMs, leading to retinal surface changes. [14,15]
The anatomical status of the photoreceptors may be evaluated by assessment of the integrity of IS/OS junction band. Disturbance of these lines is associated with poor visual acuity after surgical removal of ERM.[9,16,17] Although in idiopathic ERM such outer retinal damage may reflect only the effects of physical forces applied by the contracting inner retinal ERM to the outer retina,in uveitis patients the intraocular inflammatory milieumay contribute to photoreceptor layer disruption. [18,19] Damage to the IS/OS junction progressed significantly in our study, and these eyes had significantly poorer vision The presence of ERM in the fovea, focal attachment of ERM to the inner retina, and disruption of IS/OS junction are 3 independent factors associated with poor vision. It is expected that ERMs involving the fovea would cause greater visual impairment because of greater sensitivity to small structural alterations
The median ERM thickness at fovea and the median maximum ERM thickness showed a statistically significant increase from baseline to 1 year The results of this study demonstrate that ERM thickness in the foveal area correlates significantly with vision. Thus, the foveal ERM thickness may be a useful parameter in future visual correlative studies involving uveitic ERM patients. The progression of significant number of parafoveal ERM to foveal and progression of the thickest point towards fovea,indicates a greater tendency of foveal involvement over time.
Based on these observations, it is plausible that uveitic ERM may begin developing from the peripheral macular areas and spread toward the fovea. Defining the uveitic ERM progression pattern may affect uveitis management strategies.
CME: Intraretinal fluid acuumulation can occur due to osmotic imbalance:- decreased clearance by the RPE or increased retinal vascular permeability due to inflammation (a parameter that is taken care in this study).[20]
The vitreous is implicated in various ways for CME: The vitreous fibres adhere to muller cell end feet and exert tractional forces onto the cells and activate vascular leakage.[30]
Similar mechanism can be extended for ERM.
ERM is reported in up to 70% of uveitic eyes complicated by CME, and its presence often is associated with a poor response to medical treatment and a poor chance for visual improvement. [21-22]
Central macular thickness does not seem to be a reliable predictor of visual acuity in the presence of uveitic ERM.Although the tangential forces of a focally adherent ERM and intraocular inflammation both may contribute to the development of CME, in this study we removed that confounding factor by recording OCT parameters when the eye was quiet or relatively quiet.In our study CME attributable to traction due to ERM (after inflammation was controlled)was more commonly associated with presence of focal attachment of ERM at macula compared global attachment alone, probably signifying non uniform or greater traction.
CME is not always a prerequisite for altered foveal contour. In our study, the presence of altered foveal contour was not always due to intraretinal cystic spaces. Diffuse edema and tractional component of the ERM could have been the cause of altered contour.
Vision loss due to ERM: In eyes with uveitis and ERM, there was significant reduction in BCVA in 1 year. Also, proportion of eyes with near vision of N8 or better dropped from 100% to 53% in 1 year, with 80% having metamorphopsia.. Foveal involvement with ERM, lost foveal contour, and IS-OS disruption is associated significantly with reduced visual acuity.
Studies are required to establish the role of severity of uveitis with time taken for ERM formation, the only limitation being the non-availability of uniform scales of severity over the different anatomical subgroups.
Detection of uveitic ERM in earlier phases and in the peripheral macula and aggressive control of inflammation did not halt the progressionof ERM or prevent foveal involvement. Our study showed that despite inflammation control the visual acuity loss was significant and the ERM thickness significantly increased.The ERM thickness had no significant difference in the 3 treatment groups namely- no oral steroids, oral steroids, oral steroids and immunomodulators.
The side effects of long term oral steroids are known in medical literature and the cost of immunomodulators are high. And therefore, their unnecessary use is not warranted once inflammation is controlled only to prevent ERM and its complications as no benefits of any agents are seen in our study.
Thus, we can propose that appropriate and aggressive management of intraocular inflammation would probably delay the onset of ERM development. However, studies are required to validate it.
Surgical removal of ERM may be indicated in focally attached ERMs if they involve the fovea due to higher incidence of CME and visual loss.
Limitations of the study include, a relatively small sample size and non-randomized design. Also, in eyes with broad ERM attachment, the isolated ERM thickness could not be taken, a higher pseudo-thickness was used involving ILM.
In conclusion, this study gives better predictability of visual acuity changes with time based on characteristics of ERM on SDOCT in cases of uveitis and may also serve as a guide in tailoring proper follow up and management. Larger studies with more follow up may be required for further validation of our results.
References
- Meuer SM, Myers CE, Klein BE, Swift MK, Huang Y, Gangaputra S, et al.The epidemiology of vitreoretinal interface abnormalities as detected by spectral-domain optical coherence tomography: the beaver dam eye study. Ophthalmology. 2015;122:787-95.
- Mitchell P, Smith W, Chey T, et al. Prevalence and associations of epiretinal membranes: the Blue Mountains Eye Study, Australia. 1997;104:1033–40.
- Klein R, Klein BE, Wang Q, Moss SE. The epidemiology of epiretinal membranes.Trans Am Ophthalmol Soc. 1994;92:403–25.
- Wilkins JR, Puliafito CA, Hee MR, Duker JS, Reichel E, Coker JG, et al. Characterization of epiretinal membranes using opticalcoherence tomography. Ophthalmology. 1996;103:2142-51.
- Gomes NL, Corcostegui I, Fine HF, Chang S. Subfoveal changes in patients with longstanding epiretinal membranes. Am J Ophthalmol 2009;147:865– 868.
- Legarreta JE, Gregori G, Knighton RW, Punjabi OS, Lalwani GA, Puliafito CA. Three dimensional spectral-domain optical coherence tomography images of the retina in the presence of epiretinal membranes. Am J Ophthalmol 2008; 145:1023–1030.
- Arichika S, Hangai M, Yoshimura N. Correlation between thickening of the inner and outer retina and visual acuity in patients with epiretinal membrane. Retina 2010;30:503–508.
- Oster SF, Mojana F, Brar M, Yuson RM, Cheng L, Freeman WR. Disruption of the photoreceptor inner segment/outer segment layer on spectral domain-optical coherence tomography is a predictor of poor visual acuity in patients with epiretinal membranes. Retina 2010;30:713–718.
- Falkner-Radler CI, Glittenberg C, Hagen S, Benesch T, Binder S. Spectral-domain optical coherence tomography for monitoring epiretinal membrane surgery. Ophthalmology 2010;117:798–805.
- Nigam N, Bartsch DU, Cheng L, et al. Spectral domain optical tomography for imaging ERM, retinal edema, and vitreomacular interface. Retina 2010;30:246–253.
- Nazari H, Dustin L, Heussen FM, Sadda S, Rao NA. Morphometric spectral-domain optical coherence tomography features of epiretinal membrane correlate with visual acuity in patients with uveitis. Am J Ophthalmol. 2012;154:78-86.
- Mori K, Gehlbach PL, Sano A, Deguchi T, Yoneya S. Comparison of epiretinal membranes of differing pathogenesis using optical coherence tomography. Retina 2004;24:57–62.
- Falkner-Radler CI, Glittenberg C, Hagen S, Benesch T, Binder S. Spectral-domain optical coherence tomography for monitoring epiretinal membrane surgery. Ophthalmology 2010;117:798–805.
- Karavellas MP, Azen SP, MacDonald JC, et al. Immune recovery vitritis and uveitis in AIDS: clinical predictors, sequelae, and treatment outcomes. Retina 2001;21:1–9.
- Hiscott P, Hagan S, Heathcote L, et al. Pathobiology of epiretinal and subretinal membranes: possible roles for the matricellular proteins thrombospondin 1 and osteonectin (SPARC). Eye (Lond) 2002;16:393– 403.
- Hiscott PS, Unger WG, Grierson I, McLeod D. The role of inflammation in the development of epiretinal membranes. Curr Eye Res 1988;7:877– 892.
- Inoue M, Morita S, Watanabe Y, et al. Inner segment/outer segment junction assessed by spectral-domain optical coherence tomography in patients with idiopathic epiretinal membrane. Am J Ophthalmol 2010;150:834–839.
- Suh MH, Seo JM, Park KH, Yu HG. Associations between macular findings by optical coherence tomography and visual outcomes after epiretinal membrane removal. Am J Ophthalmol 2009;147:473– 480.
- Unoki N, Nishijima K, Kita M, Hayashi R, Yoshimura N. Structural changes of fovea during remission of Behçet’s disease as imaged by spectral domain optical coherence tomography. Eye (Lond) 2010;24:969 –975.
- Louisa W, Zdenek G. Epiretinal Membranes. InRetina, Ryan SJ., Fifth edition, Los Angeles : Elsevier; 2012, pp: 1954-60.
- Chapter in a book: Nesheim M C. Ascariasis and human nutrition. In Ascariasis and its prevention and control, D. W. T. Crompton, M. C. Nesbemi, and Z. S. Pawlowski (eds.). Taylor and Francis,London, U.K.1989, pp. 87–100.
- Roesel M, Heimes B, Heinz C, Henschel A, Spital G, Heiligenhaus A. Comparison of retinal thickness and fundusrelated microperimetry with visual acuity in uveitic macular oedema. Acta Ophthalmol 2011;89:533–537.
- Markomichelakis NN, Halkiadakis I, Pantelia E, et al. Course of macular edema in uveitis under medical treatment.Ocul Immunol Inflamm 2007;15:71–79.
Table 1: Analysis of ERM characteristics on SD-OCT
| ERM Characteristic | Baseline | 12 months | P-VALUE |
| Location | |||
| Foveal [n(%)] | 22 (65) | 30 (88) | 0.02$$ |
| Parafoveal[n(%) | 12 (35) | 4 (22) | |
| Type of Attachment at macula | |||
| Focal[n(%)] | 10 (29) | 11 (32) | 0.48 |
| Global[n(%)] | 21 (62) | 17 (50) | |
| Both Focal + Global [n(%)] | 3 (9) | 6 (18) | |
| CME due to traction*
|
|||
| Present [n(%)] | 7 (21) | 15 (43) | 0.038$$ |
| Absent [n(%)] | 27 (79) | 19 (57) | |
| Alteration in foveal contour* | |||
| Yes [n(%)] | 6 (18) | 21 (62) | <0.001$$ |
| No [n(%)] | 28 (82) | 13 (38) | |
| Associated IS/OS Junction disruption | |||
| Yes [n(%)] | 1 (3) | 11 (32) | 0.001$$ |
| No [n(%)] | 33 (97) | 23 (68) | |
| ERM thickness fovea, µ
Median (range) |
7(0,11) |
10(6,17) |
<0.001§ |
| Maximum ERM Thickness (µ)
Median (range) |
17(14,22) | 22(18,28) | <0.001§ |
| Location of maximum ERM thickness (µ from foveola)
Median (range) |
1250(778,1522) | 870(675,1190) | 0.0006§ |
*attributable to traction due to ERM after inflammation control
$$ Chi square test §Wilcoxon Signed rank test
Table 2: Analysis of Spectral-Domain Optical Coherence Tomography Characteristics of the Epiretinal Membranes in Correlation with Visual Acuity
| PARAMETER | NO OF EYES | MEDIAN
LogMAR VA |
IQR | P-VALUE¥ | SPEARMAN RANK CORRELATION |
| FOVEAL CENTRE WITH ERM | |||||
| FOVEAL | 30 | 0.3 | (0.2,0.6) | 0.011 | -0.44 |
| PARAFOVEAL | 4 | 0.15 | (0.1,0.2) | P = 0.009 | |
| FOVEAL CONTOUR | |||||
| NORMAL CONCAVITY | 13 | 0.2 | (0.1,0.3) | 0.043 | 0.351 |
| DECEASED OR LOST | 21 | 0.3 | (0.3,0.6) | P = 0.042 | |
| CYSTOID MACULAR EDEMA | |||||
| YES | 15 | 0.3 | (0.3,0.6) | 0.067 | -0.319 |
| NO | 19 | 0.2 | (0.2,0.3) | P = 0.066 | |
| ERM ATTACHMENTS§ | |||||
| FOCAL | 11 | 0.3 | (0.3,0.6) | 0.044 | -0.196
P = 0.266 |
| GLOBAL | 17 | 0.2 | (0.2,0.3) | ||
| BOTH | 6 | 0.3 | (0.3,0.3) | ||
| ISOS JUNCTION | |||||
| DISRUPTED | 11 | 0.3 | (0.3,0.8) | 0.017 | -0.414 |
| INTACT | 23 | 0.2 | (0.2,0.3) | P = 0.015 |
¥MANN WHITNEY U TEST; ¥KRUSKAL WALLIS TEST
Table 3: Analysis of association between Spectral-Domain Optical Coherence Tomography Characteristics of the Epiretinal Membranes and treatment modalities for inflammation control in 1 year follow up.
| Treatment modality | Median change in ERM thickness at fovea *(µ)(Range) | P§ | Median change in maximum ERM thickness* (µ) | P § |
| Without oral steroids (n=8) | 5(0,17) | 0.3
|
6(3,10) |
0.27
|
| Oral steriods
(n=20) |
5(0,8) | 5 (-4,24) | ||
| Oral steroids +immunomodulators(n=6) | 2.5 (0-6) | 0.5(-4,4) |
KRUSKAL-WALLIS TEST *At 12 months compared to baseline
Table 4: Visual Outcome Analysis:
| Baseline | 6 months | 12 months | P value* | |
|
Distance Vision |
0.005 |
|||
| LogMAR BCVA(mean±SD) | 0.25±0.21 | 0.28±0.20 | 0.35± 0.23 | |
|
Near vision |
||||
| ≥N8 or better [n(%)] | 34 (100) | 28 (82) | 18 (53) | 0.001 |
| N10-N18 | 0 | 6 (18) | 16 (47) | |
| <N18 | 0 | 0 | 0 | |
|
Metamorphopsia |
||||
| n(%) | 7 (20) | 12 (35) | 27 (80) | 0.001 |
*chi-square test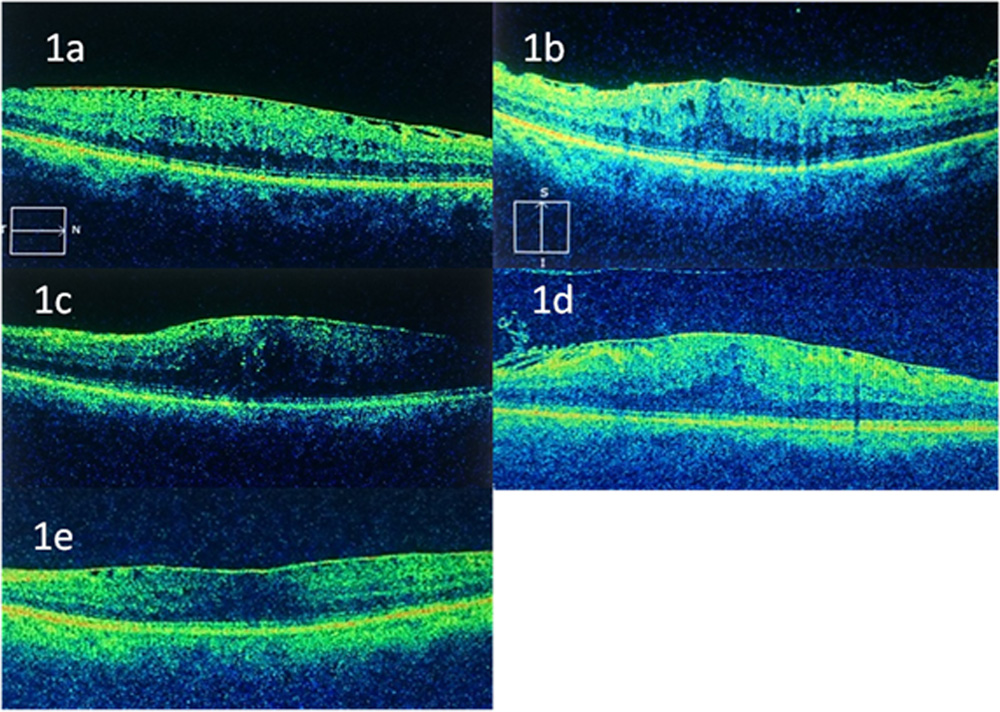
Figure legends:
Figure 1 SD-OCT images showing different configurations of ERM
(1a,b) Focal ERM; (1c,d) Global ERM; (1e) Mixed attachment
Leave a Comment