
Dr. Radhika Dashputra, R19636, Dr. Goyal J L, Dr. Ritu Arora
Introduction
Keratoconus is a progressive disorder in which central or paracentral corneal stromal thinning occurs along with apical protrusion and irregular astigmatism. It starts around puberty and progresses till third or fourth decade after which it arrests.
Clinical diagnosis of moderate to advanced keratoconus is relatively easy as there are present characteristic topographic patterns and classical clinical signs. Diagnosing early keratoconus in patients with minimal or no clinical signs is however challenging.
Corneal thinning is a key pathologic key pathologic feature of keratoconus1, therefore a keratoconus diagnosis based on corneal thickness measurement offers additional information which is not available on topography.2
The human corneal epithelium covers the surface of the cornea where it protects the eye and plays an important role in maintaining high optical quality. In keratoconus, the thickness of the epithelium becomes altered to reduce corneal surface irregularity. Therefore, the presence of an irregular stroma may be less measurable by frontal surface corneal topography.3
In cases of very early keratoconus, epithelial thickness mapping has shown that there occurs thinning of epithelium in the area of the cone with associated peripheral thickening. Thus, epithelial compensation may mask the presence of an early cone on front-surface topography and a diagnosis of keratoconus might be missed by topography alone.4
Optical Coherence Tomography is commonly used in ophthalmologic practice and provides quick acquisition. It is a noncontact imaging technology based on the principles of low-coherence interferometer that provides detailed cross-sectional images (tomography) of internal structures in biological tissue. It has been used to do pachymetry mapping and corneal epithelial thickness mapping in patients of keratoconus as well as normal subjects.5
While there are a number of studies describing epithelial mapping in keratoconus, to the best of our knowledge, no study has been conducted determining corneal epithelial thickness in subjects with keratoconus in the Indian population. There is also paucity of data for corneal epithelial thickness and corneal thickness measurement in keratoconus in young age.
A study was therefore undertaken to analyse OCT epithelial mapping and detailed tomography in keratoconus (early to advanced stage). These findings were compared with those in normal corneas.
Methods
This observational, cross sectional study included eyes with mild to advanced keratoconus and eyes with normal corneas. All eyes were assessed using scanning-slit corneal topography (Orbscan IIz, Bausch & Lomb), a rotating Scheimpflug camera (Pentacam Comprehensive Eye Scanner, Oculus Optikger€ate GmbH), and Fourier-domain OCT (RTVue, Optovue, Inc.).
Keratoconus was diagnosed if all of these criteria were found: (1) keratoconic appearance on the topography map (asymmetric bow tie with skewed radial axis, central or inferior steep zone, or clawshape); (2)positive topographic indices on scanning-slit corneal topography assessment (mean keratometry [K]>47.0 diopters [D] or inferior–superior value [I–S] >1.4 D in the central 3.0 mm, according to Rabinowitz and McDonnell criteria)(Rabinowitz89); (3) positive rotating Scheimpflug camera assessment (1 or more of a central keratometry index [CKI] >1.03, a keratometry index [KI] >1.07, and a positive topographic keratoconus classification)(Ucakhan 2011); and (4) at least 1 clinical sign. A corneal specialist evaluated the slitlamp findings for Munson sign, Vogt striae, Fleischer ring, apical thinning, Rizutti sign, and corneal scarring consistent with keratoconus.
The staging of keratoconus was done as per Amsler Krumeich grading. Fellow eyes of unilateral keratoconus were classified under form fruste keratoconus.
Exclusion criteria included previous ocular surgery or trauma; associated corneal pathologic features; a history of collagen crosslinking, intrastromal corneal ring segment implantation, keratoplasty, or other corneal surgery; and contact lens wear during the previous 3 weeks.
The OCT pachymetry and epithelial thickness map scans were acquired with a Fourier-domain OCT system (RTVue, Optovue, Inc.). The instrument uses an 840 nm wavelength light source. It has a scan speed of 26 000 A-scans per second. It has a transverse resolution of 15 µ and an axial resolution of 5 µ (in tissue). A corneal-adapter-module (CAM) lens was mounted for anterior segment imaging. The pachymetry scan pattern was used to map the cornea. The pattern consists of 8 high-definition meridional scans (1024 axial scans per meridian) acquired in 0.32 seconds. The scan diameter of the pachymetry and epithelial map in this study was 6.0 mm. The maps were divided into the following octant zones: superior, superotemporal, temporal, inferotemporal, inferior, inferonasal, nasal, superonasal, central, and annular rings (2.0 mm, 5.0 mm, and 6.0 mm diameters). The location of the minimum corneal thickness and epithelial thickness was marked as “*” in the respective maps.
Each eye was scanned 3 times during a single visit with the subject sitting. The subject’s head was stabilized with a chin–forehead rest. The subject’s gaze was fixed with an internal fixation target. The OCT and video camera images were displayed in real time to aid alignment. Subjects were repositioned after each OCT scan. The pachymetry scans were centred using the pupil. Epithelial thickness at minimum pachymetry was obtained by pointing mouse to point of minimum pachymetry and recording the corresponding epithelial thickness.
The data was entered into an Excel sheet. Mean ± standard deviation values of each corneal pachymetric and epithelial thickness variables were calculated for both normal and keratoconus group.
Pachymetric and epithelial thickness variables obtained on anterior segment optical coherence tomography were compared in normal and keratoconic eyes. SPSS v23 was used for statistical analysis. For comparison between 2 groups, 2 tailed test was used while ANOVA was used for comparison between >2 sub-groups of keratoconus. P-values <0.05 were considered statistically significant.
Receiver operating characteristic (ROC) curve analyses were performed to evaluate the diagnostic performance of the pachymetric and epithelial thickness variables. The area under ROC curve (AROC) was calculated for each variable. A cut off value of each variable was selected with the highest average of sensitivity and specificity. Corresponding sensitivity and specificity values were recorded.
Results
The study assessed 200 eyes of subjects in age group 7 to 30 years from October 2015 to March 2017 recruited from patients presenting at outpatient department at a tertiary care hospital in northern India. Of these, 100 eyes of 57 patients had keratoconus while 100 eyes of 51 age matched patients presenting for refractive evaluation were taken as controls. The mean age of patients with keratoconus was 19.54±4.88 years (range 12-30). The mean age of control subjects was 18.29±5.68 years (range 8-29). There was no significant difference in the age distribution (P=0.126).
Of the 100 eyes of keratoconus enrolled in the disease, 15 eyes had form fruste disease (FFK), 21 eyes had grade I (KC I), 26 eyes had grade II (KC II), 23 eyes had grade III (KC III), 15 eyes had grade IV keratoconus (KC IV). Subjects in the form fruste group and grade I keratoconus were considered under the early keratoconus group for statistical analysis (N = 36).
Table 1 Mean values of ASOCT pachymetric parameters evaluated in the groups
| Parameter | Control | FFK | KC I | KC II | KC III | KC IV | ANOVA | Early vs Control |
| Pachymetry (µm) | ||||||||
| SN-IT | 21.57±15.34 | 44.26±20.18 | 42.26±16.46 | 40.5±34.08 | 62.69±22.04 | 57.4±22.03 | <0.001 | <0.001 |
| S-I | 15.35±14.54 | 41.00±27.99 | 33.33±21.28 | 32.61±31.16 | 56±23.05 | 46.8±44.62 | <0.001 | <0.001 |
| Min-Med | -20.95±20.36 | -43.4±23.77 | -38.62±14.49 | -48.46±32.19 | -54±20.26 | -76.26±46.86 | <0.001 | <0.001 |
| Y location | -350.28±618.12 | -786.6±475.34 | -801.43±543.13 | -845.23±695.87 | -1046.09±650.62 | -577±860.33 | <0.001 | <0.001 |
| Min Pachy | 514.04±30.36 | 463.26±36.13 | 446.76±21.43 | 425.46±41.34 | 398.6±30.44 | 382.86±19.53 | <0.001 | <0.001 |
| Central | 521.88±29.63 | 476.6±36.17 | 468.52±22.62 | 454.07±36.42 | 436.52±44.04 | 414.86±30.14 | <0.001 | <0.001 |
Table 2 Mean values of ASOCT epithelial parameters evaluated
| Parameter | Control | FFK | KC I | KC II | KC III | KC IV | ANOVA | Early vs control |
| E TCZ | 51.06±2.69 | 50±5.68 | 48.85±3.66 | 47.27±4.21 | 45.43±6.07 | 46.06±7.28 | <0.001 | 0.038 |
| E MP | 49.79±2.89 | 47.8±7.41 | 47.42±3.62 | 44.42±4.78 | 45.39±7.35 | 46.46±5.51 | <0.001 | 0.024 |
| E Min | 48.81±3.36 | 44±7.54 | 44.76±5.11 | 41.8±5.05 | 37.78±8.14 | 33.8±10.29 | <0.001 | <0.001 |
| Central | 54.46±2.63 | 51.13±4.85 | 53.09±4.3 | 51.03±4.4 | 48.56±7.07 | 51.06±4.71 | <0.001 | <0.001 |
| Std Dev | 1.96±1.18 | 3.92±2.15 | 3.74±1.47 | 4.51±1.7 | 5.55±2.52 | 7.34±2.24 | <0.001 | <0.001 |
Figure 1 shows the ROC curve of pachymetric difference between between superonasal and inferotemporal quadrants (SN-IT) with an area under curve (AROC) of 0.8599. A positive test result corresponds to keratoconus and a negative test result to normal corneas. At a cut off of 32µ of superonasal-inferotemporal difference, keratoconus could be diagnosed with 81% sensitivity and 80% specificity.(Figure 2)
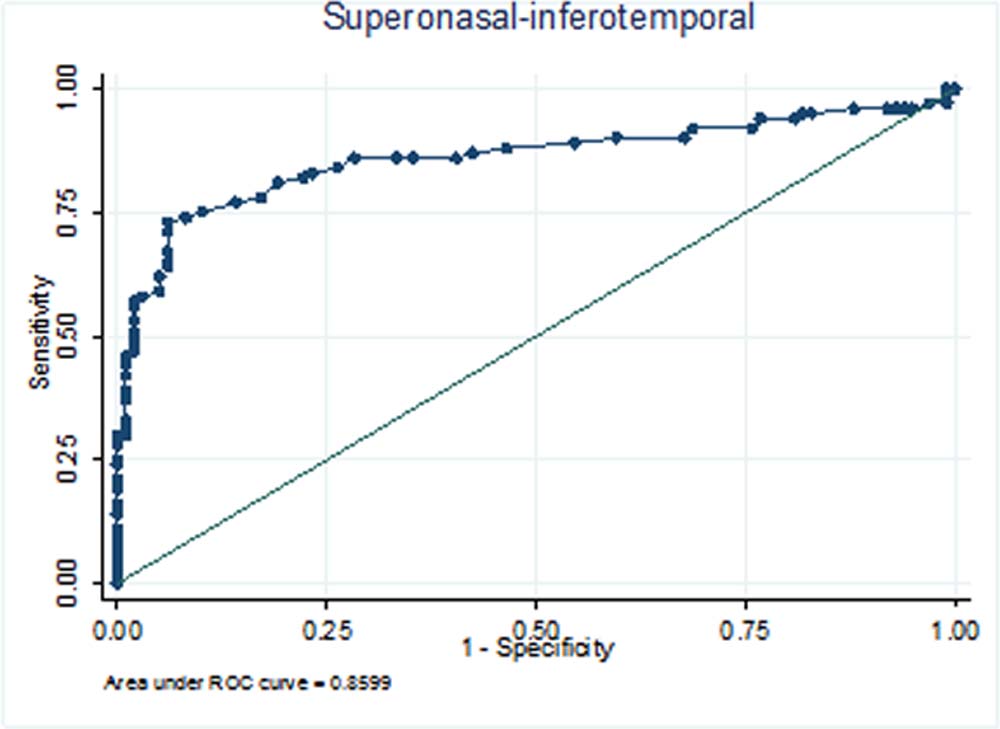
Figure1 : ROC curve of Superonasal-Inferotemporal
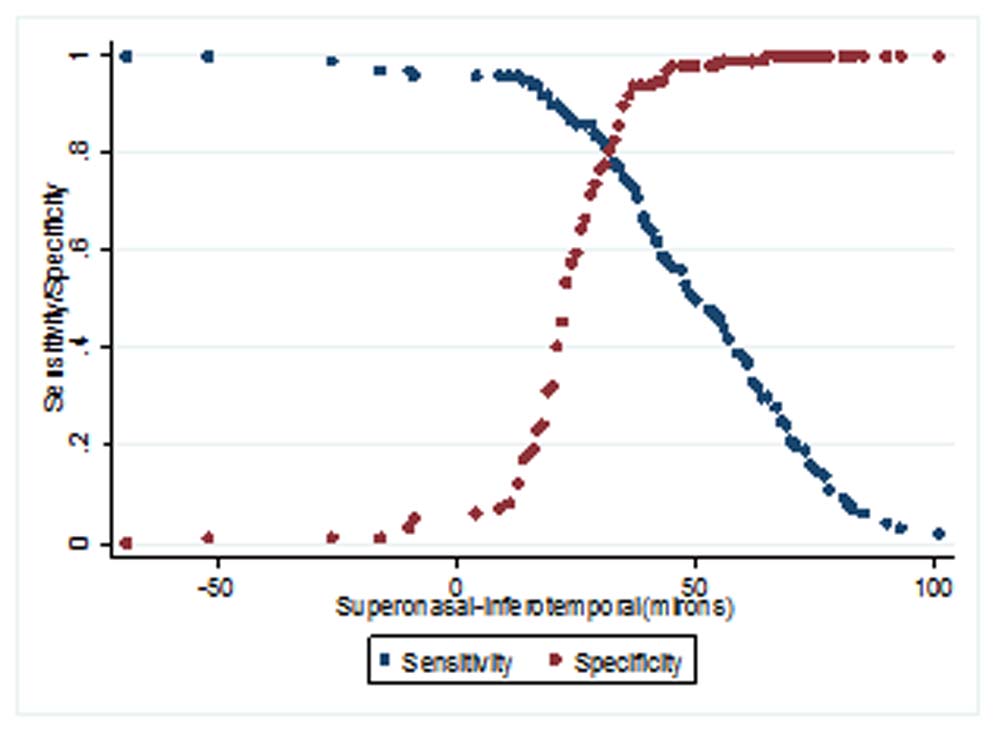
Figure2: Sensitivity-Specificity curve for Superonasal-Inferotemporal
Since the sensitivity and specificity were high, we conducted the ROC analysis for SN-IT parameter for normal versus early keratoconus. Area under the ROC curve (AUC) was 0.844. With a cut off value of 32µ early keratoconus could be diagnosed with 75% sensitivity and 80% specificity.
Figure 3 shows the ROC curve of standard deviation of epithelial thickness with an area under curve (AROC) of 0.8934. A positive test result corresponds to keratoconus and a negative test result to normal corneas. With a cut off value 2.5 for epithelial thickness standard deviation, keratoconus could be diagnosed with 87% sensitivity and 85% specificity.
Since the sensitivity and specificity were high, we conducted the ROC analysis for standard deviation of epithelial thickness for normal versus early keratoconus. Area under the ROC curve (AUC) was 0.832. With a cut off value 2.5, early keratoconus could be diagnosed with 77% sensitivity and 84% specificity
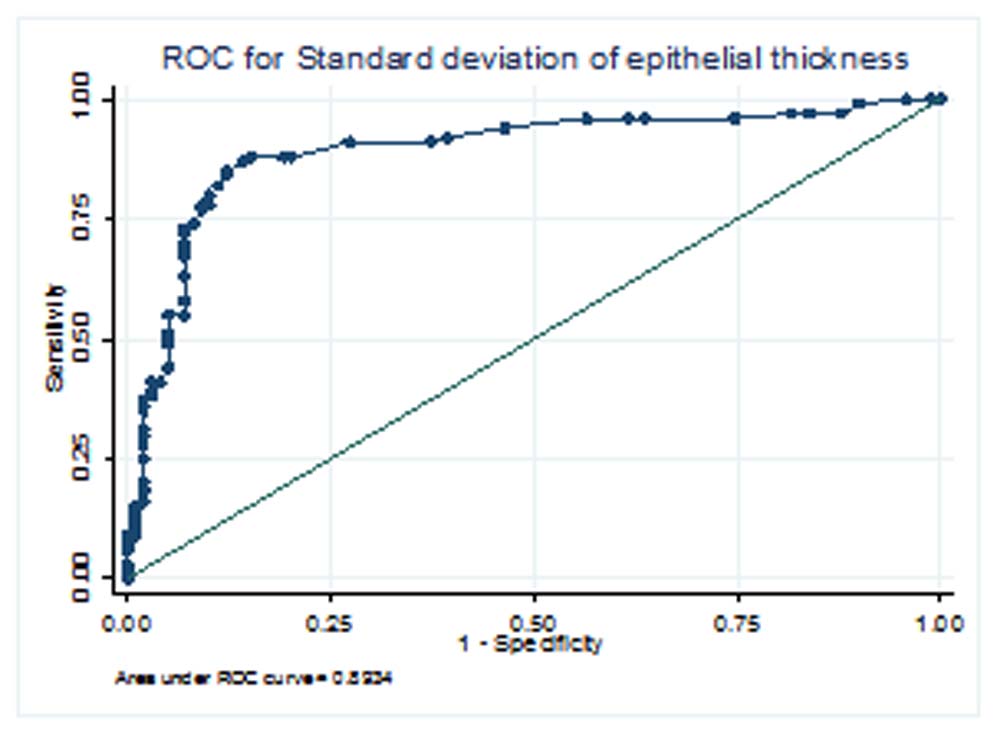
Figure 3: ROC curve for standard deviation of epithelial thickness
Other pachymetric and epithelial thickness variables were also analyzed but no definite cut off value could be achieved due to wide variation in the sensitivity and specificity of each parameter.
| Sr.No. | Parameter | AROC | Cut off | Sensitivity (%) | Specificity (%) |
| 1. | Superonasal-Inferotemporal | 0.8599 | 32µ | 81 | 80 |
| 2. | Superior-Inferior | 0.7809 | 37µ | 58 | 97 |
| 3. | Minimum-Median | 0.9219 | -187µ | 100 | 1 |
| 4. | Y Location | 0.6905 | -537µ | 38 | 43 |
| 5. | Minimum Pachymetry | 0.9596 | 481µ | 99 | 1 |
| 6. | Central corneal thickness | 0.9309 | 362µ | 100 | 1 |
| 7. | Epithelial thickness at thinnest corneal zone | 0.7387 | 45µ | 77 | 7 |
| 8. | Epithelial thickness at minimum pachymetry | 0.7369 | 47µ | 72 | 7 |
| 9. | Minimum epithelial thickness | 0.8549 | 47µ | 23 | 21 |
| 10. | Central epithelial thickness | 0.7470 | 54µ | 24 | 30 |
| 11. | Superior epithelial thickness | 0.5407 | 52µ | 43 | 47 |
| 12. | Inferior epithelial thickness | 0.7182 | 53µ | 32 | 28 |
| 13. | Standard deviation of epithelial thickness | 0.8934 | 2.5 | 87 | 85 |
Discussion
Corneal thinning is a key pathologic feature of keratoconus; therefore, a keratoconus diagnosis based on corneal thickness measurement may offer additional information not available on topography.
The study was designed to include subjects in the younger age group as keratoconus has been shown to present at an earlier age and with rapid progression in the Asian population.6 While the mean age of keratoconus subjects was19.54±4.88 years in our study, that of controls was18.29 ± 5.68 years.
Previous studies have only included subjects ≥18years (range 18 to 60 years), with none of them reporting data from pediatric age group, thus missing out on an important demographic.5,7,8,9
Studies using ultrasound or slit scanning technologies have found that the difference (or ratio) between the peripheral and the thinnest (or central) corneal thickness was significantly greater in eyes with keratoconus than in normal eyes.10,11,12,13
Pachymetry mapping was done using Fourier-domain OCT software developed by Li et al7 to identify pattern of corneal thinning in keratoconus. Several diagnostic parameters were constructed from the OCT pachymetric map with the aim of capturing the focal and asymmetric nature of keratoconic corneal thinning.
In our study, the mean SN-IT was 21.57±15.34µ and 49.14±26.02µ in control and keratoconus subjects respectively. This was comparable to the IT-SN value of -22.0±11.4µ for controls reported in a previous study.7 However, the previous value reported for IT-SN in keratoconus was -63.0±35.7µ.
Inferotemporal (IT) is thinner than superonal (SN). This difference is minimal in control group but heightened in keratoconus as cones are typically located inferotemporally. Our findings demonstrate that SN-IT progressively increases with grade of keratoconus (44.26±20.18µ in form fruste, 42.26±16.46µ in grade I, 40.5±34.08µ in grade II, 62.69±22.04µ in grade III and 57.4±22.03µ in grade IV keratoconus). The present study had a significant number of early disease cases (N=36) while the study by Yan Li et al had mainly established keratoconus cases.7
The area under ROC for SN-IT showed a good diagnostic accuracy between normal and keratoconus (AROC= 0.859) comparable to previously reported AROC= 0.894. With a cut off value of 32µ for SN-IT keratoconus could be diagnosed with 81% sensitivity and 80% specificity.
Additional comparison of the parameter between normal and early keratoconus showed good differentiating ability (AROC= 0.844). The 32µ cut off diagnosed early disease with 75% sensitivity and 80% specificity.
This cut off has better sensitivity as compared to the 48.2µ value given in earlier study which had a 62% sensitivity for keratoconus diagnosis. No previous values are available for comparison in the early keratoconus group.
The corneal epithelium is the first cellular layer of the human cornea and protects the eye. Accurate and reproducible measurement of corneal epithelial thickness provides important information for assessing corneal remodeling as an early sign of keratoconus.4 Many efforts had been made to measure the corneal epithelial thickness. Li,14 Erie,15 Patel16 and their colleagues reported central epithelial thicknesses of 41–50.6 μ in normal corneas measured by confocal microscopy. Their measurements, which excluded the pre-corneal tear film thickness, were thinner than the central epithelial thickness of 54.23 ± 2.63 μ in normal eyes that we obtained. This mapping was done using epithelial mapping software. Our measurements included the thickness of tear film, about 3 μ, which probably accounts for the difference.17
Reinstein et al.3,4 pioneered corneal epithelial thickness mapping using very high frequency ultrasound over the entire corneal surface. The central epithelial thickness of normal eyes from their study, which excluded the tear film, was 53.4 ± 4.6 μm. Their research also demonstrated that corneal epithelium was thicker inferiorly than superiorly in the normal corneas. Our observation (mean superior epithelial thickness 51.72±2.88µ and inferior epithelial thickness 53.48±2.47µ) agreed with their results.
Visual inspection of epithelial maps showed that the point of minimum epithelial thickness did not corroborate with that of minimum pachymetry in many subjects. While the minimum thickness of epithelial point often lay in the area with thinning, it did not coincide with minimum pachymetry. Some cases even demonstrated minimum pachymetric point far away from the area of cone. Our finding show a disagreement from those of Temstet et al, who repoted that the thinnest epithelial point corresponded with thinnest corneal point in their study.5 To overcome this dilemma, epithelial thickness was noted at the point of minimum pachymetry also.
Visual inspection of the epithelial maps also showed the presence of epithelial thinning surrounded by an annulus of thickened epithelium, the so called epithelial ‘Doughnut pattern’ as reported by Reinstein et al.3 They proposed that this epithelial pattern could mask underlying stromal thinning. Doughnut pattern was seen in14 out of 26 eyes of stage II keratoconus and 13 out of 23 eyes of stage III keratoconus. The doughnut pattern could not be identified in early keratoconus cases.
Several investigators have previously used time-domain OCT systems to measure corneal epithelial thickness. Among them, Sin, Haque, Feng and their colleagues reported central corneal epithelial thicknesses of 52–54.7μ in normal eyes, values that are very close to our measurement (54.46±2.63µ). In contrast, Wang et al., also using a time-domain system, reported a thicker value, 59.9 ± 5.9 μ.
The epithelial thickness parameters (Epithelial thickness in thinnest corneal zone, Epithelial thickness at minimum pachymetry, Minimum, Central, Superior, Inferior epithelial thickness) showed a statistically significant difference on comparison between normal and keratoconus group (p value <0.001). There was decrease in their values on comparison between normal and keratoconus, pointing towards a generalised epithelial thinning in keratoconus. This is in agreement to previous reported results.5,7
Li et al reported a minimum epithelial thickness value of 46.0±4.3µ in normal and 40.0±6.0µ in keratoconus.7 This was lower than what we found. Only one study has previously reported epithelial thickness in different grades of keratoconus. Sandali et al18 found a compensatory increase in epithelial thickness at the cone the epithelium thickness increased from stage 1 (43.1±11.8 µ) to stage 2 (59.7±13.6 µ) and then stage 3 (90.7±29.7 mm) but not between stages 3 and 4.
Standard deviation of epithelial thickness in different zones showed a statistically significant difference on comparison between normal and keratoconus (p value <0.001). There was trend towards increasing standard deviation with progressive grades of keratoconus. (mean epithelial standard deviation 3.92±2.15µ in form fruste, 3.74±1.47µ in stage I, 4.51±1.7µ in stage II, 5.55±2.52µ in stage III and 7.34±2.24µ in stage IV keratoconus).
The diagnostic powers of these variables were assessed using the ROC analysis. Very good diagnostic ability was demonstrated by parameters standard deviation (AROC=0.8934) and minimum epithelial thickness (AROC= 0.8549). Parameters like epithelial thickness at thinnest corneal zone (AROC=0.7357), minimum epithelial thickness (AROC=0.8549), Central (AROC=0.7470) and inferior (AROC=0.7182) had fair diagnostic ability. The superior corneal thickness had a poor diagnostic ability (AROC=0.5407). These findings are in agreement from a previously reported study.7
Diagnostic cut off value 2.5 for the standard deviation of epithelial thickness from all the zones as a parameter had a 87% sensitivity and 85% specificity for diagnosis of keratoconus. Early cases could be diagnosed with the same cut off using a sensitivity of 77% and specificity of 84%. A comparable index to this could not be found in literature. A Root mean square pattern deviation (RMSPD) variable was described based on image analysis by Li et al,7 however, the values and analysis pattern were not comparable to our parameter.
One limitation of the technology used in this study is that RTVue-CAM OCT provides pachymetric and epithelial thickness maps of only the central 6-mm diameter of the cornea. The 6-mm map size may be sufficient for planning myopic LASIK and photorefractive keratectomy since the central corneal tissue is ablated most for myopic refractive surgery procedures. It may be sufficient for keratoconus screening because a previous study showed that the cone apex was located inside the central 5-mm diameter of the cornea in the vast majority of keratoconic eyes.(tang 2005). However, the 6-mm map size is a limitation for diseases involving the peripheral cornea, such as pellucid marginal degeneration.
A combination of pachymetric variables (SN-IT and S-I) and standard deviation of epithelial thickness provides highly sensitive and specific parameters for the diagnosis of keratoconus in suspicious cases of keratoconus especially in younger age group. Value of 32µ for SN-IT pachymetry and 2.5 for SD of epithelial thickness may be considered as additional parameters in the early diagnosis of keratoconus in Indian scenario. To the best of our knowledge, these parameters have not been analysed for their adjunctive value.
References
- Krachmer JH, Feder RS, Belin MW. Keratoconus and related noninflammatory corneal thinning disorders. Surv Ophthalmol. 1984;28:293-322.
- Ambrosio R Jr, Alonso RS, Luz A, Coca Velarde LG. Corneal thickness spatial profile and corneal-volume distribution: tomographic indices to detect keratoconus. J Cataract Refract Surg. 2006;32:1851–9.
- Reinstein DZ, Archer TJ, Gobbe M. Corneal epithelial thickness profile in the diagnosis of keratoconus. J Refract Surg. 2009; 25:604–10
- Reinstein DZ, Gobbe M, Archer TJ, Silverman RH, Coleman DJ. Epithelial, stromal, and total corneal thickness in keratoconus: three-dimensional display with Artemis very-high frequency digital ultrasound. J Refract Surg. 2010; 26:259–71.
- Temstet C, Sandali O, Bouheraoua N, Hamiche T, Galan A, Sanharawi ME, et al. Corneal epithelial thickness mapping using Fourier-domain optical coherence tomography for detection of form fruste keratoconus. J Cataract Refract Surg. 2015; 41:812-20.
- Jonas J, Nangia V, Matin A, Kulkarni M, Bhojwani K. Prevalence and Associations of Keratoconus in Rural Maharashtra in Central India: The Central India Eye and Medical Study. Am J Ophthalmol. 2009;148(5):760-5.
- Li Y, Tan O, Brass R, Weiss JL, Huang D. Corneal epithelial thickness mapping by Fourier-domain optical coherence tomography in normal and keratoconic eyes. Ophthalmology. 2012;119:2425–33
- Rocha KM, Perez-Straziota CE, Stulting RD, Randleman JB. SD-OCT analysis of regional epithelial thickness profiles in keratoconus, postoperative corneal ectasia, and normal eyes. J Refract Surg. 2013; 29:173–9.
- Kanellopoulos AJ, Asimellis G. OCT corneal epithelial topographic asymmetry as a sensitive diagnostic tool for early and advancing keratoconus. Clin Ophthalmol. 2014;8:2277-87.
- Avitabile T, Marano F, Castiglione F, Reibaldi A. Keratoconus staging with ultrasound biomicroscopy. Ophthalmologica 1998;212(suppl):10 –2.
- Avitabile T, Marano F, Uva MG, Reibaldi A. Evaluation of central and peripheral corneal thickness with ultrasound biomicroscopy in normal and keratoconic eyes. Cornea 1997; 16:639–44.
- Gromacki SJ, Barr JT. Central and peripheral corneal thickness in keratoconus and normal patient groups. Optom Vis Sci 1994;71:437– 41.
- Owens H, Watters GA. An evaluation of the keratoconic cornea using computerised corneal mapping and ultrasonic measurements of corneal thickness. Ophthalmic Physiol Opt 1996;16:115–23.
- Li HF, Petroll WM, Moller-Pedersen T, et al. Epithelial and corneal thickness measurements by in vivo confocal microscopy through focusing (CMTF). Curr Eye Res. 1997; 16:214–21.
- Erie JC, Patel SV, McLaren JW, et al. Effect of myopic laser in situ keratomileusis on epithelial and stromal thickness: a confocal microscopy study. Ophthalmology. 2002; 109:1447–52.
- Patel SV, Erie JC, McLaren JW, Bourne WM. Confocal microscopy changes in epithelial and stromal thickness up to 7 years after LASIK and photorefractive keratectomy for myopia. J Refract Surg. 2007;23:385–92.
- Azartash K, Kwan J, Paugh JR, et al. Pre-corneal tear film thickness in humans measured with a novel technique;Mol Vis [serial online] 2011 17:756–67.
- Sandali O, Sanharawi ME, Temstet C, Hamiche T, Galan A, Ghouali W, et al. Fourier-Domain Optical Coherence Tomography Imaging in Keratoconus. Ophthalmology. 2013;120(12):2403–12
Leave a Comment