


![]()
![]()
Col . RANGACHARI AWARD (Joint Award)
Dr. Anand Vinekar, V10089, Dr. Shetty Bhujang K, Dr. Chaitra Jayadev, Dr. Shivani Sinha
Abstract:
Aim: To correlate pro-angiogenic & inflammatory factors in the TEARS of infants with ROP
Methods: TEARS from 44 infants undergoing ROP screening were analysed using cytometric bead array for a) proangiogenic factors: VEGF-A, angiogenin & fractalkine, b) adhesion molecules:VCAM-1 & ICAM-1 c) inflammatory mediators: IL-6, IL-8, RANTES & MCP-1. Two gestational age-matched cohorts: Any stage ROP & No ROP was correlated with the TEAR results
Results: Higher levels of TEAR VEGF, Angiogenin, MCP-1 & RANTES (p < 0.001) were observed in the FIRST visit of infants who spontaneously regressed compared to higher stages of ROP. IL-6 showed an inverse trend. TEAR VEGF (p < 0.001) and MCP-1 (p<0.05) levels at FIRST visit were lower in infants who developed ROP later than controls
Discussion: Non-invasively collected TEARS during the FIRST ROP screening visit has key biomarkers that can predict progression of disease. This will aid risk stratification, clinical triage and reduction in ROP blindness
Introduction:
Approximately 60,000 children globally are blind due to retinopathy of prematurity (ROP). Developing countries like India and Latin America are facing the third epidemic of ROP. The incidence of ROP was found to be 41.5% and 26.4% of these eyes were type 1 ROP in a rural district NICU. The gold standard of ROP isshifting from indirect ophthalmoscopy to wide-field photodocumentation but both of them require multiple sessions before a clinical conclusion is reached.
Angiogenic and inflammatory pathways plays a role in development of ROP. Association of various cytokines with ROP have been studied in vitreous, serum and cord blood. Cytokine levels ofIGF 1 and VEGF have been found useful in predicting the risk of ROP. But invasive procedures are required to acquire these body fluids. The need of a non invasive easy screening test to determine at risk babies is warranted to aid in management of ROP
Tears have long been used as a biomarker in various systemic diseases like multiple sclerosis, Parkinsons disease, Tay Sachs disease and even in breast cancer. Tears have been used to study the role of various cytokines in keratoconus and dry eye disease as well and has helped in modulation of treatment strategy. In diabetic retinopathy tear levels of TNF alpha have been used to predict the severity of disease.
The tears have not been yet used to evaluate the various angiogenic and inflammatory cytokine levels in ROP or for predicting the infants at risk of developing ROP. The study aims to evaluate the role of tears in predicting ROP in infants as a non invasive novel method.
Methodology:
Study design and clinical examination:
The prospective longitudinal study was approved by the NarayanaNethralaya Institutional Review Board (IRB) and Ethics Committee. The guidelines followed were in accordance with the tenets of the Declaration of Helsinki. Study Subjects were recruited for the study after obtaining informed written consent from parents or guardian of the infant. Study subjects were the infants undergoing routine ROP screening according to the Indian national guidelines in the KIDROP programme. The infants were followed up until a favorable outcome was achieved. The favorable outcome was taken either as complete vascularization of the retina or regression of the stage of ROP. All the screening sessions were imaged using Retcam (Clarity MSI, USA).
A total of 44 patients were recruited and were divided into two groups. Group 1 consisted of 23 infants with any stage ROP eight infants each in Stage 1 and Stage 2 ROP and seven infants in stage 3 ROP disease respectively. Sixteen infants were categorized as group 2 consisting of 16 controls further classified as infants with immature retina in zone 3 (n=8); immature retina in zone 2 and zone 3 (n=6) and almost fully vascularized (vessels entering zone 3 but not reaching the oraserrata (n=2)
Tear sample collection:
Tear samples were collected using Schirmer’s strips by following Schirmer’s test I protocol at every screening visit. Tear analytes were extracted from Schirmer’s strips by cutting them into small pieces, agitation in sterile phosphate buffer solution (PBS) for 2 hours at 4°C followed by centrifugation.
Measurement of angiogenic factors, cytokine and chemokine:
The levels of various inflammatory and angiogenic factors in the tears were measured using cytometric bead array (BD CBA Human Soluble Protein Flex Set System, BD Biosciences, Haryana, India) on a flow cytometer (BD FACSCalibur, BD Biosciences). The markers were chosen based on literature in ROP and its impact in retinal disease pathways. A preliminary analysis of these Cytokines were made and the ones detected were included. The CBA for this study was designed for simultaneous detection and quantification ofangiogenic factors: Vascular Endothelial Growth Factor (VEGF), angiogenin; chemokines:Regulated on Activation, Normal T Cell Expressed and Secreted (RANTES), monocyte chemotactic protein (MCP)-1, Fractalkine; cytokines: IL 6 , IL8 and adhesion molecule: L–selectin, Intercellular Adhesion Molecule 1 (ICAM1) and Vascular Cell Adhesion Msolecule (VCAM).
Statistical analysis:
All statistical analyses were performed with GraphPad Prism 6.0 (GraphPad Software, Inc., La Jolla, CA). Shapiro-Wilk normality test was used to check distribution of the data set. Mann-Whitney U test was used to analyze data.
Results:
The study cohort was equally distributed with respect to gender as well as at the age of the sample collection(Table 1, 2).
Based on the subsequent second visit the study subjects were classified as infants with either progressing or regressing disease. Progressive disease referred to those infants who worsened to a higher stage of disease on subsequent second visit. Infants who showed resolution to a lower stage of disease were grouped in regressing disease. The angiogenic factors VEGF and angiogenin were both significantly upregulated in regressing compared to progressing stage (p<0.001)(Figure 1). The chemokines RANTES (p<0.05) and MCP 1 (p<0.001) were both upregulated in regressing when compared to progressing stage(Figure 2). The cytokines IL 6 and IL 8 do not follow a similar pattern, IL 6 was upregulated in progressing stage in contrast to IL 8 but it was not statistically significant(Figure 3).The other study parameters did not show a specific pattern and significant difference amongst groups.
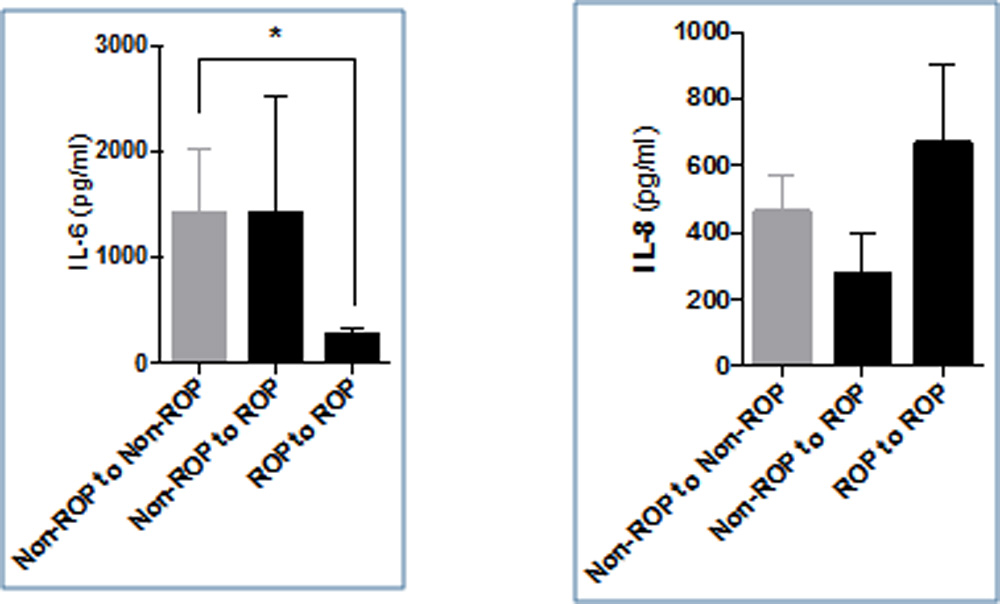
The study subjects were further classified on the basis of second visit in three groups consisting of “non-ROP to non ROP” constituting controls, cases were further categorized as “non ROP to ROP” (infants who progressed from no stage ROP to some stage ROP on second visit)and “ROP to ROP”. The level of VEGF was higher in controls compared to the cases and was significantly higher when compared to non-ROP to ROP group (p<0.001)(Figure 4).Angiogenin was found to be high in ROP to ROP group compared to other group and was significantly higher compared to non ROP to ROP group (p<0.001)(Figure 4). All the three chemokines were lowest in non ROP to ROP group compared to other two groups. Only MCP 1 was statistically higher in controls compared to non ROP to ROP group(Figure 5). IL6 in contrast was lowest in ROP to ROP group and was statistically significant compared to controls(Figure 6). The other study parameters did not show a specific pattern and significant difference amongst groups.
Discussion:
This is the first prospective study taken in infants with ROP to evaluate the role of tears in predicting at risk babies of developing the disease.
The main findings of the study is being enumerated as follows:
- The levels of angiogenic factors i.e VEGF and angiogenin were elevated in patients who showed a resolution of disease stage compared to the progressing stage. This reflects presence of more angiogenic factors in a maturing retina which is in contrast to the fact that a maturing retina must express less of angiogenic factors
- Thechemokines RANTES and MCP 1 followed a similar pattern. The chemokines functions as chemo attractant as well as angiogenic factors and thus aid in neovascularization. RANTES have been found to be elevated in the first month after birth.
- The cytokine IL-6 and IL-8 both have a role in inflammation and ocular neovascularization.IL -6 is found to be increased in progressing stage rather than in regressing stage. The reverse is true for IL-8. The inverse behavior of IL-8 can be attributed to its disputed anti-angiogenic property.
- Significantly low levels of VEGF were found in infants at first visit who later developed disease. Low level of VEGF at first visit can serve as a predictive tool for identifying infants at risk of developing ROP.
- MCP 1 also had a similar pattern resembling VEGF.
- Both angiogenic and inflammatory markers were increased in mature retina when compared to immature retina.
These contrasting results of higher levels of angiogenic and inflammatory markers in maturing retina can be due to normal angiogenesis present at various other anatomic sites in the early life of a neonate. Also, the levels of these factors differ with the post menstrual age as well. So, the tear levels may not represent the actual intraocular levels but the association is important to determine at risk babies of developing or worsening ROP.
The estimation of VEGF and inflammatory marker MCP 1 can be assessed at first visit to determine at risk babies of developing or progressing ROP. This can aid us in determining the frequency of visit of these patient and an early intervention to further progression of disease process.
The study establishes a association between low angiogenic and inflammatory markers with the development of ROP. To establish temporal causal relationship a larger sample size is needed. As there has bee no studies in ROP with tears, the relationship of these factors could not be determined with the actual intraocular milieu. The samples were also not paired for age. The other confounding risk factors like sepsis were not taken in account during analysis.
Angiogenesis is a balance between proangiogenic and angiogenic factors. Inflammation aids in normal angiogenesis too. The early acute imbalance as seen in ROP may lead to neovascularization. The study highlights the imbalance in the early postmenstrual age in form of low angiogenic and pro-inflammatory markers in the babies who subsequently developed ROP or worsened to a higher stage. This novel study demonstrates the feasibility of using tears in preterm infants undergoing routine ROP screening using non-invasive and easy to employ methods to obtain vital information about their team analytes which can be used for risk categorization, prognostication, and follow-up. This has provided us a new tool in the management of these tiny and precious babies.
References:
- Romero LC, Padilla JA, Marco A et al. Detection and treatment for retinopathy of prematurity in Mexico: Need for effective programs. J AAPOS. 2008; 12:225-6.
- Hungi B, Vinekar A, Datti N, Kariyappa P, Braganza S, Chinnaiah S, Donthi K, Shetty B. Retinopathy of prematurity in a rural neonatal intensive care unit in South India—a prospective study. Indian J Paediatr. 2012 Jul 1; 79:911-5.
- Sato T, Kusaka S, Shimojo H, Fujikado T. Simultaneous analyses of vitreous levels of 27 cytokines in eyes with retinopathy of prematurity. Ophthal. 2009; 116:2165-9.
- Silveira RC, Fortes Filho JB, Procianoy RS. Assessment of the contribution of cytokine plasma levels to detect retinopathy of prematurity in very low birth weight infants. Invest Ophthalmol Vis Sci. 2011;52:1297-301.
- Woo SJ, Park KH, Lee SY, Ahn SJ, Ahn J, Park KH, Oh KJ, Ryu A. The Relationship Between Cord Blood Cytokine Levels and Perinatal Factors and Retinopathy of Prematurity: A Gestational Age-Matched Case-Control StudyCord Blood Cytokine Levels, Perinatal Factors, and ROP. Invest Ophthalmol Vis Sci. 2013; 54:3434-9.
- Villegas-Becerril E, Gonzalez-Fernandez R, Perula-Torres L, Gallardo-Galera JM. IGF-I, VEGF and bFGF as predictive factors for the onset of retinopathy of prematurity (ROP). Archivos de la Sociedad Española de Oftalmología. 2006; 81:641-6.
- Salvisberg C, Tajouri N, Hainard A, Burkhard PR, Lalive PH, Turck N. Exploring the human tear fluid: discovery of new biomarkers in multiple sclerosis. Proteomics-Clinical Applications. 2014; 8:185-94
- Börger M, Funke S, Bähr M, Grus F, Lingor P. Biomarker sources for Parkinson’s disease: Time to shed tears?. Basal Ganglia. 2015; 5:63-9
- Singer J, Cotlier E, Krimmer R. Hexosaminidase A in tears and saliva for rapid identification of Tay-Sachs disease and its carriers. The Lancet. 1973; 302:1116-9
- Lebrecht A, Boehm D, Schmidt M, Koelbl H, Grus FH. Surface-enhanced laser desorption/ionisation time-of-flight mass spectrometry to detect breast cancer markers in tears and serum. Cancer Genomics-Proteomics. 2009; 6:75-83.
- Shetty R, Ghosh A, Lim RR, Subramani M, Mihir K, Ranganath A, Nagaraj S, Nuijts RM, Beuerman R, Shetty R, Das D. Elevated Expression of Matrix Metalloproteinase-9 and Inflammatory Cytokines in Keratoconus Patients Is Inhibited by Cyclosporine ARole of Cyclosporine A in Keratoconus. Invest Ophthalmol Vis Sci. 2015; 56:738-50.
- Solomon A, Dursun D, Liu Z, Xie Y, Macri A, Pflugfelder SC. Pro-and anti-inflammatory forms of interleukin-1 in the tear fluid and conjunctiva of patients with dry-eye disease. Invest Ophthalmol Vis Sci. 2001; 42:2283-92.
- Costagliola C, Romano V, De Tollis M, Aceto F, Romano MR, Pedicino C, Semeraro F. TNF-alpha levels in tears: a novel biomarker to assess the degree of diabetic retinopathy. Mediators of inflammation. 2013;2013.
- Kathleen Brennan and JialinZheng, Interleukin 8, In xPharm: The Comprehensive Pharmacology Reference, Elsevier, New York:2007;1-4
Table 1: Table showing distribution of gender in group 1 and group 2
| Female | Male | P value | |
| Group 1 | 10 | 13 | >0.05 |
| Group 2 | 7 | 9 | >0.05 |
Table 2: Table showing postmenstrual age at first visit and final visit in group 1 and group 2
| First visit | Final visit | |
| Group 1 | 35 weeks 3 days
|
46 weeks 2 days
|
| Group 2 | 34 weeks 6 days
|
40 weeks 1 day
|
Figure 1: Bar graph showing levels of VEGF and angiogenin at first visit who progressed to a higher stage or regressed to a lower stage on subsequent second visit.
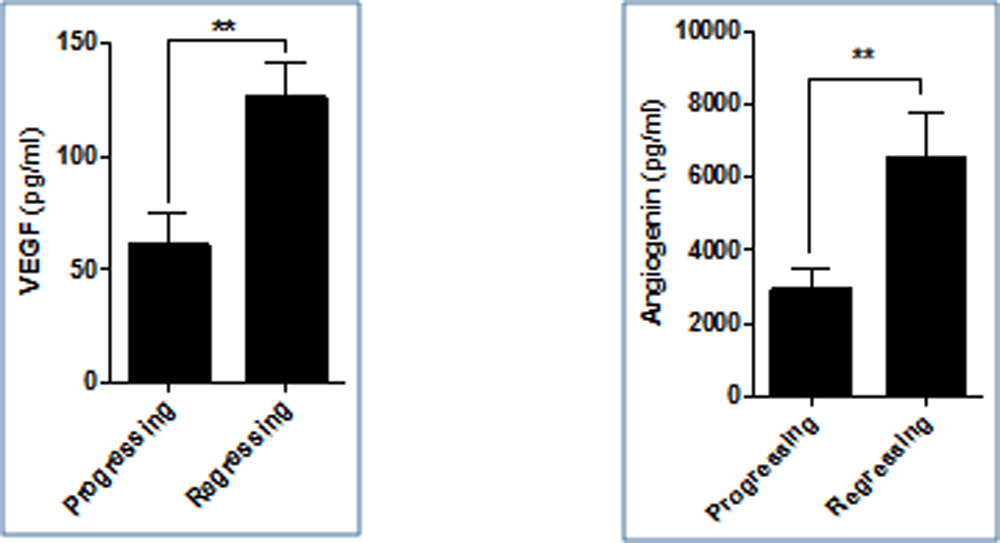
Figure 2: Bar graph showing levels of RANTES and MCP1 at first visit who progressed to a higher stage or regressed to a lower stage on subsequent second visit
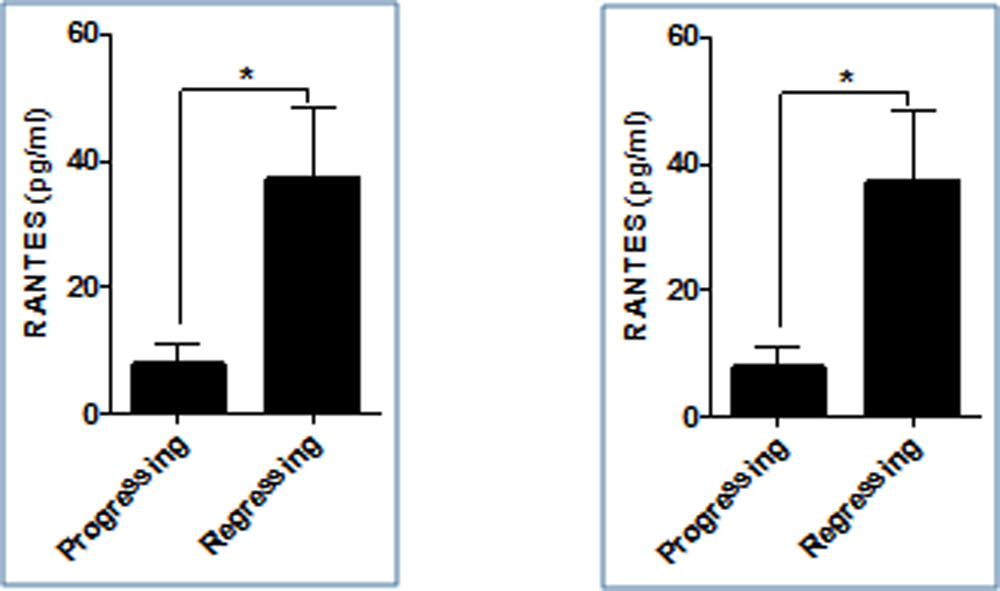
Figure 3: Bar graph showing levels of IL 8 and IL 6 at first visit who progressed to a higher stage or regressed to a lower stage on subsequent second visit
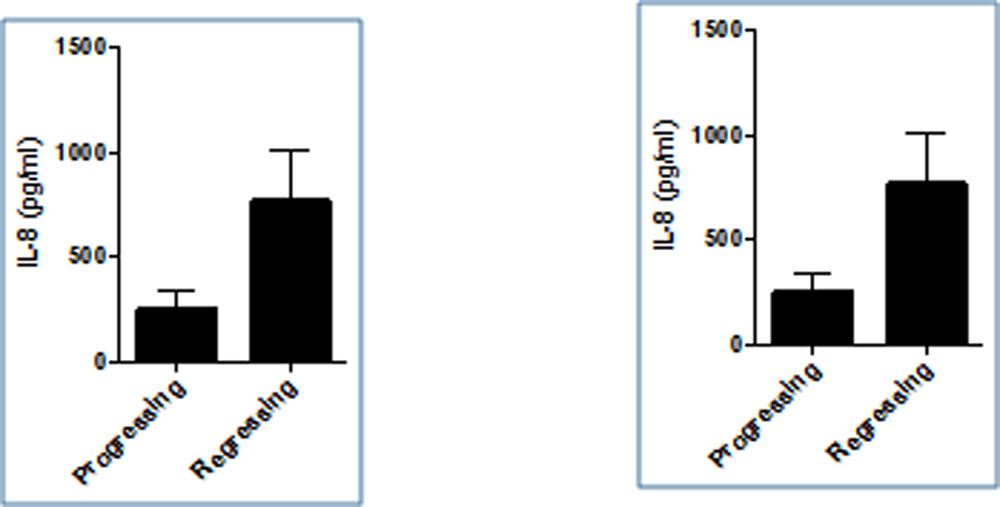
Figure 4: Bar graph showing levels of VEGF and angiogenin at first visit in controls (Non ROP to non ROP), infants who progressed from no ROP to some stage ROP and in subjects who had ROP at first visit
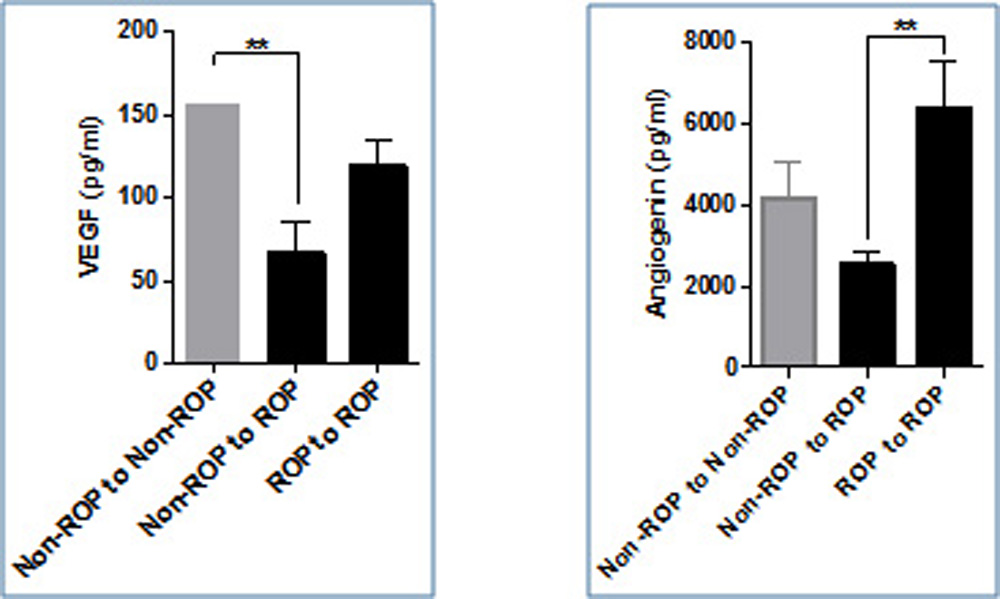
Figure 5: Bar graph showing levels of MCP 1 and RANTES at first visit in controls (Non ROP to non ROP), infants who progressed from no ROP to some stage ROP and in subjects who had ROP at first visit
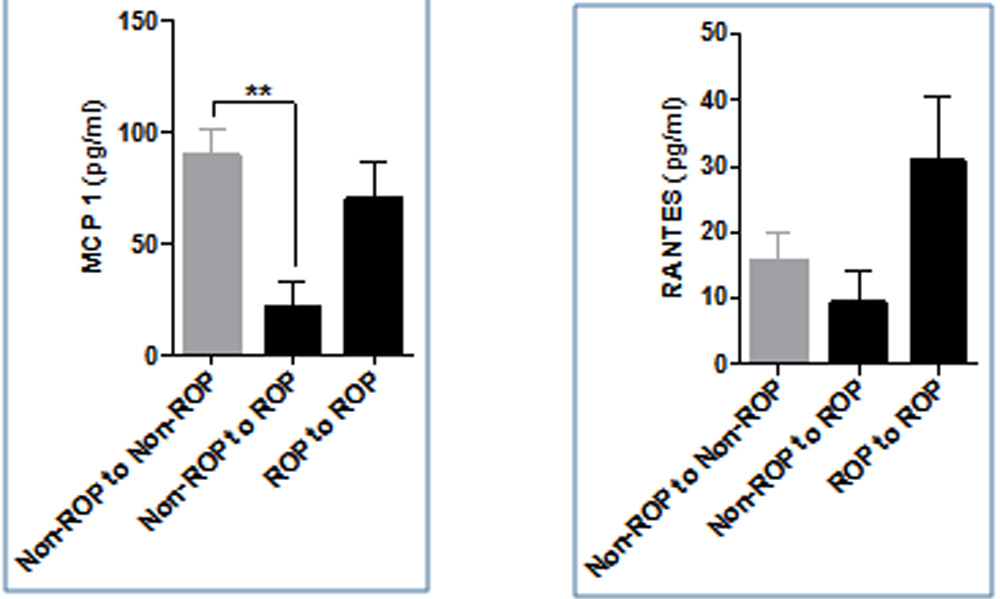
Figure 6: Bar graph showing levels of IL 6 and IL 8 at first visit in controls (Non ROP to non ROP), infants who progressed from no ROP to some stage ROP and in subjects who had ROP at first visit
Leave a Comment