
Dr. Madhu Manjari, M18745, Dr. Mohan Rajan, Dr. Shalini S, Dr. Sujatha Mohan
AIM :
To study the outcomes and compare C3R, Topography guided photorefractive keratectomy with C3R and INTACS with C3R in the management of keratoconus in a tertiary eye care centre.
MATERIAL & METHODS
We conducted a non randomised prospective, comparative and interventional study on 52 patients over a period of 18 months. It was an attempt to study the outcomes of C3R, PRK with C3R and Intacs with C3R and compare the outcomes of these procedures. The outcomes were studied in terms of UCVA, BCVA, manifest refraction – sphere and cylinder, topographic keratometric values – steep K and flat K and topographic astigmatism. The effectiveness of the procedures were analyzed by comparing outcomes based on Topographic data such as steep K, flat K and astigmatism value. The patients were followed up for a period of 6 months postoperatively.
INCLUSION CRITERIA
- Clinical and topographic evidence of Keratoconus
- Keratoconus patients with Poor contact lens fit/unhappy with glasses or contact lenses
- Corneal pachymetry>400
- Astigmatic range for
C3R alone – low astigmatism ≤ 2D
PRK with C3R-moderate astigmatism >2 to <5D
INTACS with C3R – high astigmatism ≥ 5D
EXCLUSION CRITERIA
- Patients with a history of corneal surgery
- History of chemical injury or delayed epithelial healing
- Corneal pathologies like Corneal opacity, corneal dystrophy, Concurrent corneal infection and severe dry eyes
- Patients with collagen, autoimmune or other systemic disease
- Immunocompromised patients
- Patients with known sensitivity to riboflavin.
- Pregnancy or lactation during the course of study
METHODS
- Each patient underwent manifest refraction evaluation as well as assessment of Uncorrected Visual acuity (UCVA) and Best spectacle corrected visual acuity (BSCVA) using high contrast Snellen visual acuity chart and then converted to the respective log MAR scale values.
- A slit lamp biomicroscopic examination was performed in all patients which gave clue to the presence of Keratoconus in the patients either by presence of Fleischer ring, central or paracentral corneal thinning, Vogt’s straie and/or Munson’s sign.
- Corneal topography was performed using Topolyzer, (WaveLight Laser Technologie AG, Erlangen, Germany). The following parameters were analysed
– Ks-steepest meridian of the cornea in central 3mm
– Kf-flattest meridian of the cornea in central 3mm
- Corneal thickness was measured using the ultrasound Pachymetry.
- Intraocular pressure measurement by Goldmann applanation tonometry
- Fundus evaluation
After the initial evaluation, according to the inclusion criteria, each patient underwent the respective procedure. Patients undergoing C3R were allotted to Group 1, those undergoing Topo- guided photorefractive keratectomy followed by C3R were allotted to Group 2 and those undergoing Intacs with C3R were allotted to Group 3.
CORNEAL COLLAGEN CROSSLINKING:
Topical anesthetic should be applied before the procedure. The central 8mm of the corneal epithelium was removed using a blunt knife or 30 seconds of application of20% alcohol. As a photosensitizer, riboflavin 0.1% solutionin dextran T-500 20% solution was applied every 2 minutes for 30 minutes before the irradiation.The UVA irradiation (370 nm) using UV-XTM (Figure 1) was applied at a 5-cm working distance for 10 minutes using a 9mW/cm2 irradiance (~5.4J/cm2)and the riboflavin drops was instilled every 2 minutes during the irradiation
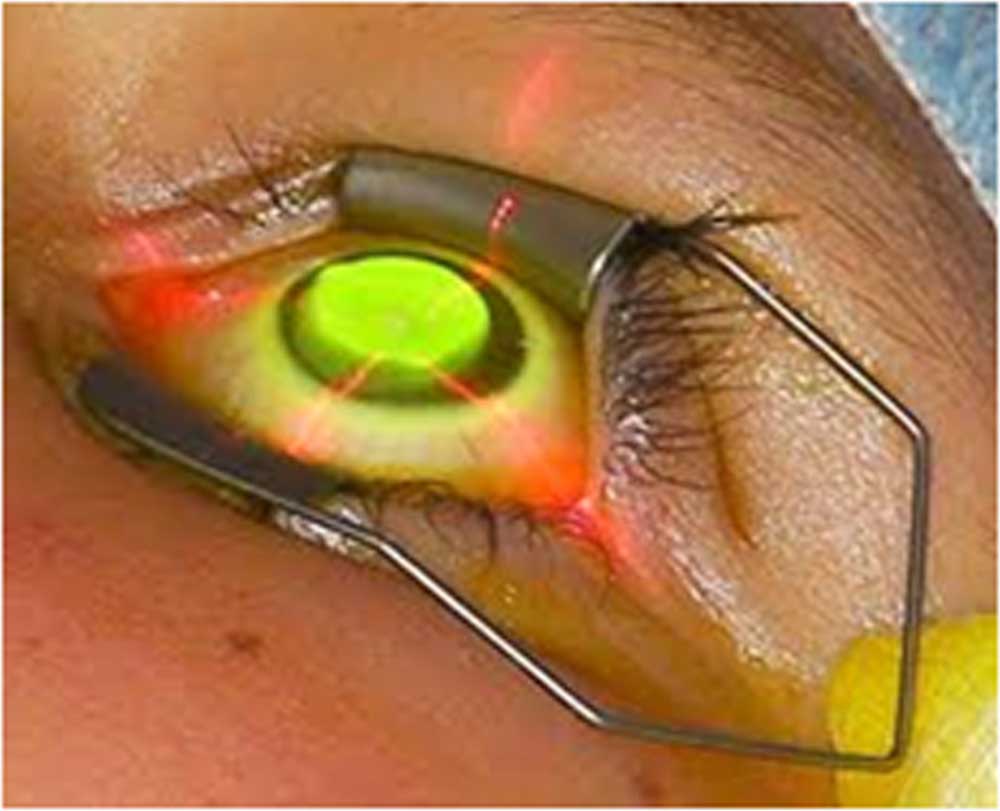
Figure 1: UVA irradiation
PHOTOREFRACTIVE KERATECTOMY WITHCORNEAL COLLAGEN CROSSLINKING:
After instilling a topical anesthetic solution (proparacaine 0.5%), the eyelid was held open using a speculum. An 8.5mm optical zone titanium trephine marker was applied firmly to the corneal surface, centered on the visual axis, and filled with 20% ethanol in balanced salt solution which was applied for 20 seconds after which the epithelium was wiped with a dry sponge(Figure 3).We then performed T-CAT (topography- guided custom ablation treatment) by linking the Topolyzer with the WaveLight Allegretto WaveTM Excimer Laser System (WaveLight Laser Technologic AG). All parameters, like the amount of analyzed area, pupil detection, ring detection etc., were correctly identified by the Topolyzer with the camera image.The wavelength of 1064nm was generated using a major ND: YAG laser system and through special cultivated crystals, 213nm is used. The maximum ablation we perform is 40µm in the thinnest region of the cornea. The laser treatment is then applied (Figure 3).
A cellulose soaked sponge in Mitomycin C 0.02% was applied over the ablated tissue for 20 seconds followed by irrigation with 10 ml of chilled balanced salt solution. This was then followed immediately by corneal collagen crosslinking with Riboflavin.
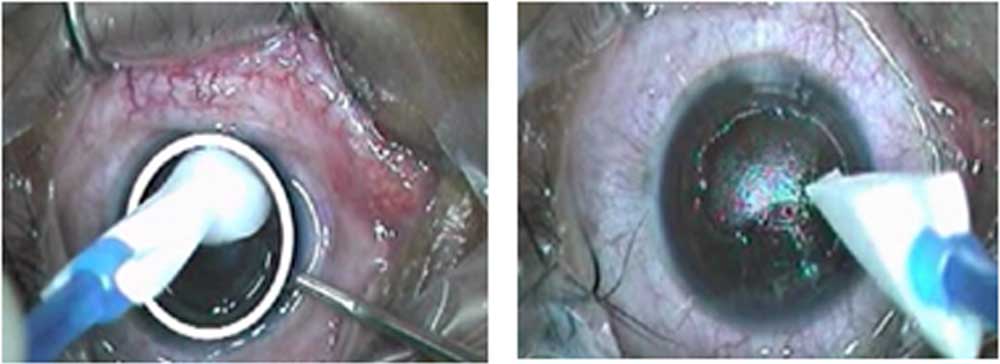
Figure 2: Removal of epithelium in PRK
Figure 3:LASER ablation in PRK
INTACS WITH CORNEAL COLLAGEN CROSSLINKING
After the preliminary preparation of the patients, they are positioned under a femtosecond laser and a disposable suction device is applied to the eye to fixate the globe. The cornea is marked over the center of the entrance pupil under a separate operating microscope by using the tip of a Sinskey hook. After channel creation by femtosecond laser, the suction device is removed and the segments are inserted(Figure 4).
This procedure is followed by C3R as mentioned above.
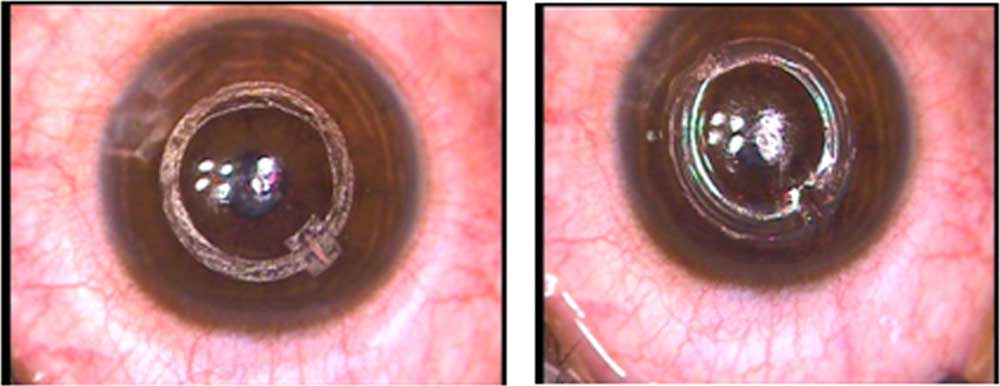
Figure 4: Channel creation followed by segment insertion
OBSERVATION AND RESULTS
(Group 1 – C3R, Group 2 – PRK with C3R, Group 3 – Intacs with C3R)
DISTRIBUTION OF STUDY POPULATION
Table 1
| NO OF SUBJECTS | |
| GROUP 1 | 18 |
| GROUP 2 | 17 |
| GROUP 3 | 17 |
Graph 1
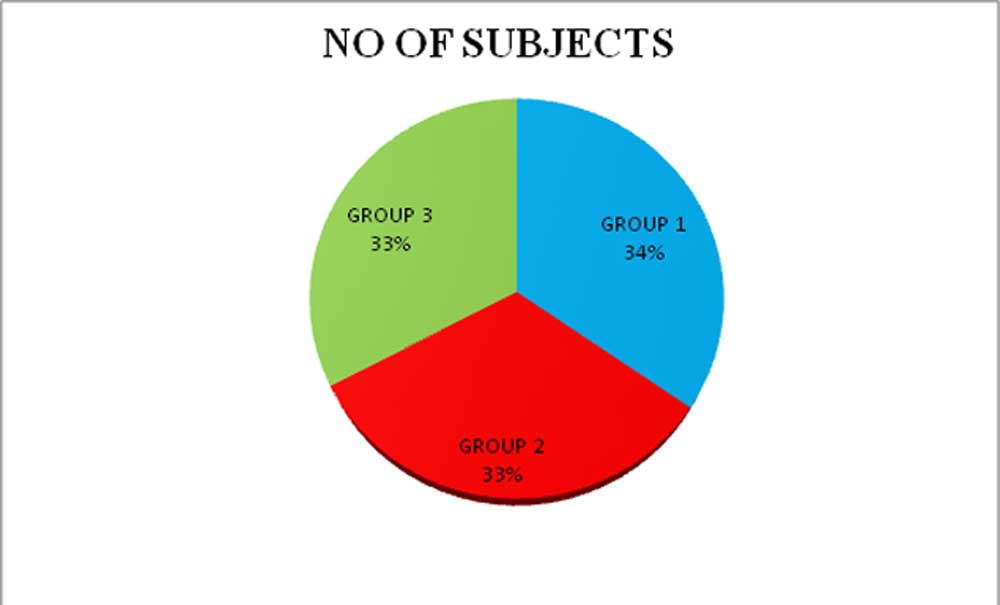
A total of 52 subjects were included in our study, with Group 1 having 18 subjects and remaining 2 groups having 17 subjects each.
AGE DISTRIBUTION OF THE STUDY POPULATION
Table 2
| AGE
(IN YEARS) |
GROUP
1 |
|
GROUP
2 |
GROUP
3 |
| 18-20 | 7 | 4 | 8 | |
| 21-25 | 4 | 6 | 8 | |
| >26 | 7 | 7 | 1 |
Graph 2
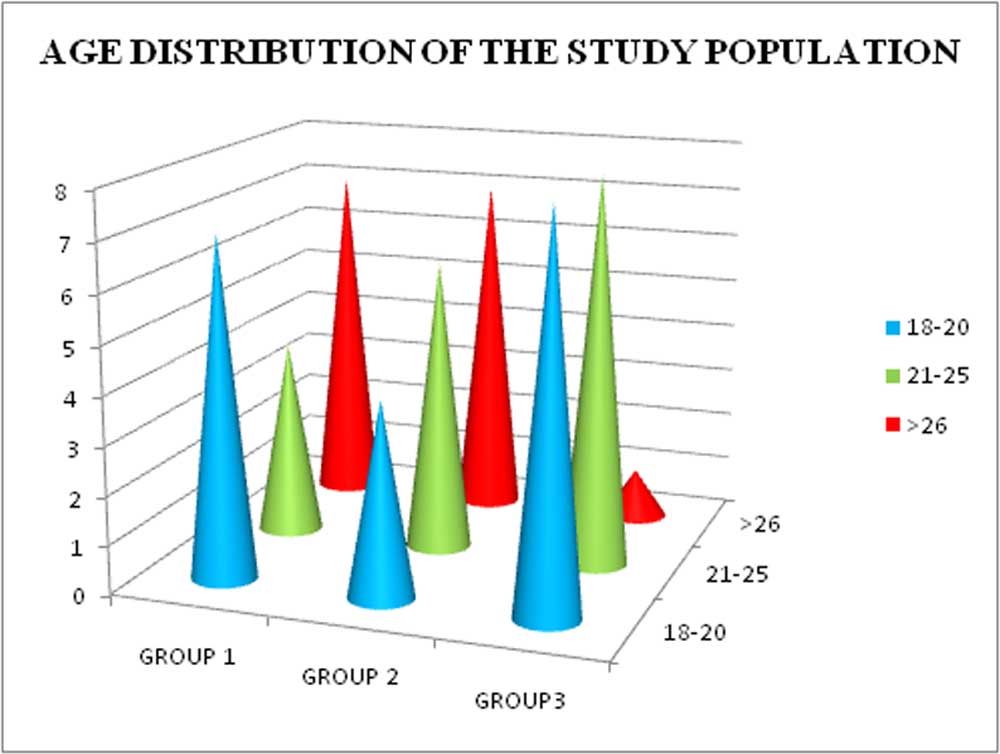
The age distribution of the study population was not equally distributed amongst the three groups as the allotment of the patients were purely based on the diagnosis of keratoconus and the distribution was based on the cylindrical refraction.
OBSERVATION OF CHANGE IN UCVA PRE AND POST PROCEDURES
Table 4
| UCVA
PREOP |
UCVA AT
1 WEEK |
UVCA AT
1 MONTH |
UCVA AT
6 MONTHS |
|
| GROUP 1 | 0.47 | 0.65 | 0.77 | 0.72 |
| GROUP 2 | 0.81 | 0.65 | 0.67 | 0.54 |
| GROUP 3 | 0.87 | 0.79 | 0.78 | 0.74 |
Graph 4
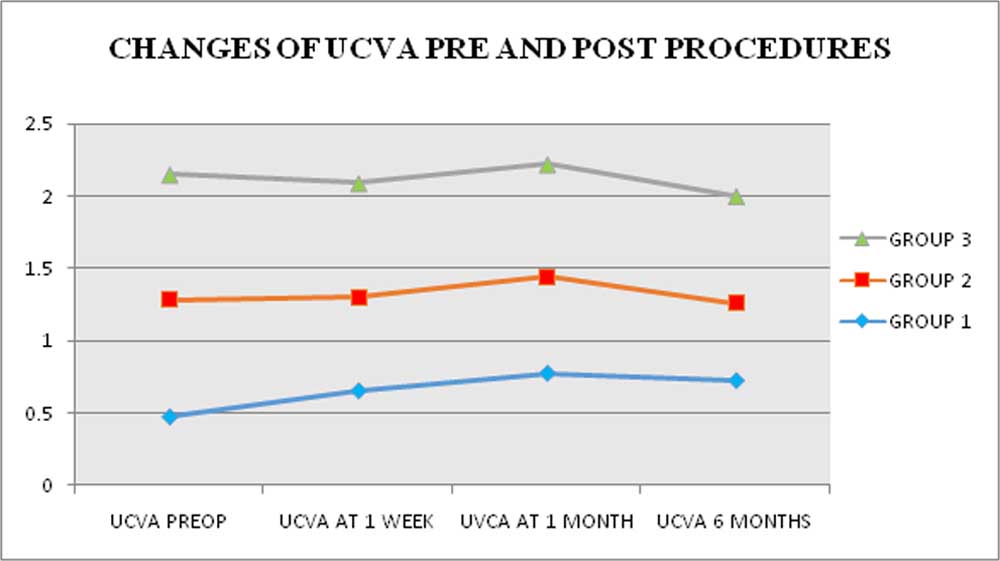
The UCVA graph of Group 2 and 3 approaches 0 Log Mar units post procedure, similar to their respective BCVA graph. In group 1, the average UCVA shows worsening after the procedure.
OBSERVATION OF CHANGE OF BCVA PRE AND POST PROCEDURES
Table 3
| BCVA
PREOP |
BCVA AT
1 WEEK |
BCVA AT
1 MONTH |
BCVA AT
6 MONTHS |
|
| GROUP 1 | 0.05 | 0.08 | 0.08 | 0.06 |
| GROUP 2 | 0.21 | 0.15 | 0.15 | 0.1 |
| GROUP 3 | 0.33 | 0.17 | 0.2 | 0.18 |
Graph 3
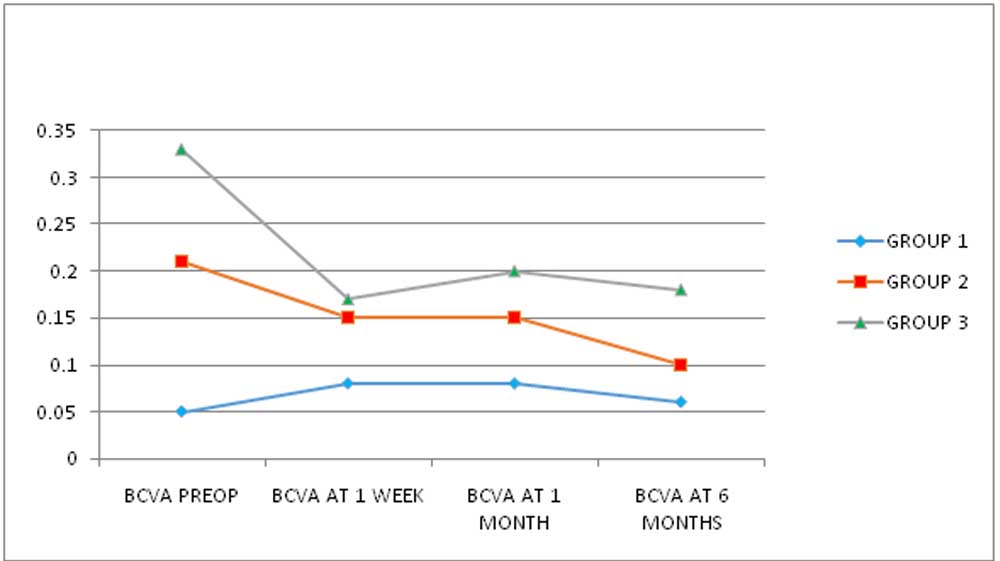
The above graph clearly shows the post procedure BCVA of Group 2 and 3 approaching 0 Log Mar units, thereby emphasizing the effectiveness of these procedures. In group 1, the average BCVA seems to be worsening immediately after the procedure and then approaching 0 Log Mar units only after 1 month post op.
OBSERVATION OF CHANGE IN SPHERE PRE AND POST PROCEDURES
Table 6
| SPHERE PREOP | SPHERE AT 1 WEEK | SPHERE AT 1 MONTH | SPHERE AT 6 MONTHS | |
| GROUP 1 | -2.2 | -2.1 | -2 | -2 |
| GROUP 2 | -1.25 | -0.069 | -1 | -0.88 |
| GROUP 3 | -1.8 | -0.47 | -0.42 | -0.47 |
Graph 6
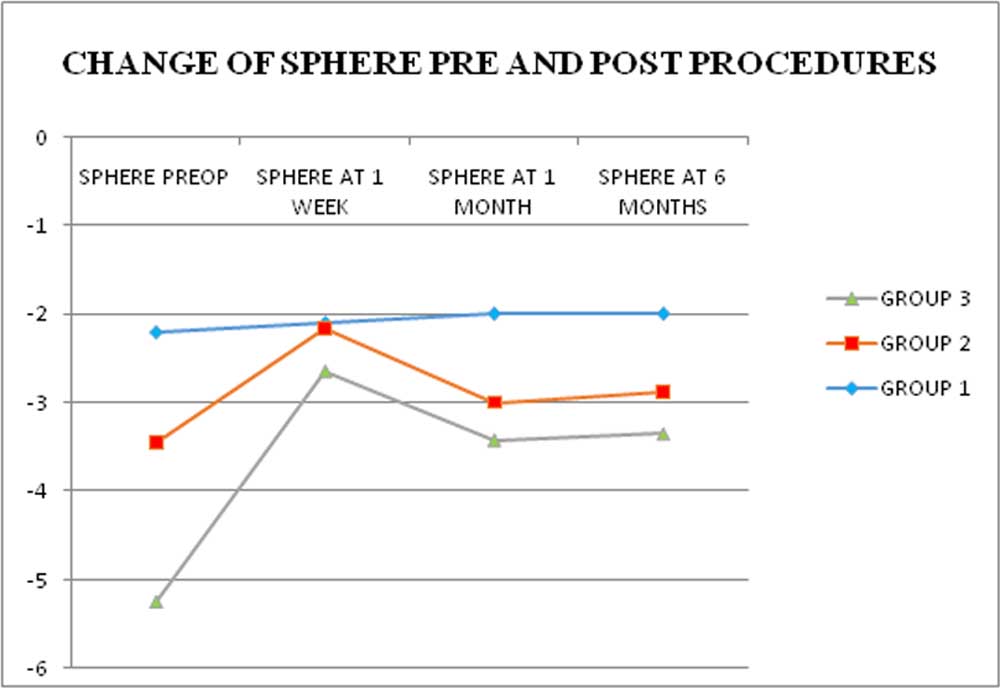
Group 2 and 3 showed considerable reduction in spherical refraction at one week review, and then there was stabilization of the spherical refractive power thereafter. Group 1 showed minimal reduction in spherical refraction and that too, remained stable after the first review.
OBSERVATION OF CHANGE IN CYLINDERS PRE AND POST PROCEDURES
Table 5
| CYLINDER PREOP | CYLINDER AT
1 WEEK |
CYLINDER AT
1 MONTH |
CYLINDER
AT 6 MONTHS |
|
| GROUP 1 | -1.52 | -1.88 | -1.8 | -1.7 |
| GROUP 2 | -3.33 | -2.92 | -2.39 | -2.07 |
| GROUP 3 | -6.58 | -4.19 | -4.29 | -4.11 |
Graph 5
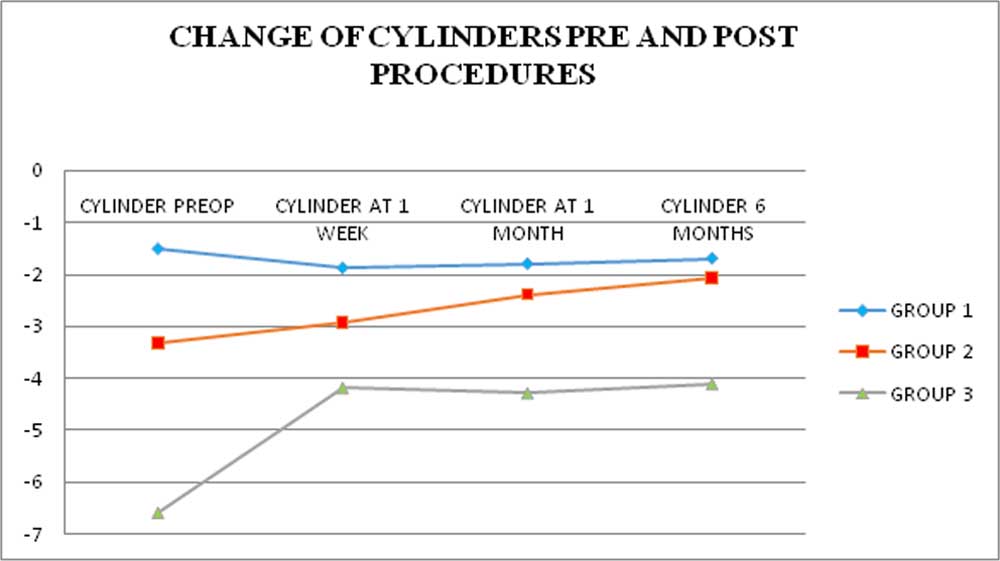
Subjects of group 2 and 3 had considerable reduction and stabilization of their cylindrical powers, post surgery. Group 1 subjects following the surgery, showed initial worsening of the cylindrical power and then stabilization of the same after 1 week review.
OBSERVATION OF CHANGE IN STEEP K PRE AND POST PROCEDURES
Table 8
| STEEP K PREOP | STEEP K AT
1 WEEK |
STEEP K AT
1MONTH |
STEEP K AT
6 MONTH |
|
| GROUP 1 | 47.2 | 46.8 | 46.72 | 46.5 |
| GROUP 2 | 47.04 | 46.66 | 46.46 | 45.69 |
| GROUP 3 | 51.63 | 47.95 | 47.79 | 47.41 |
Graph 8
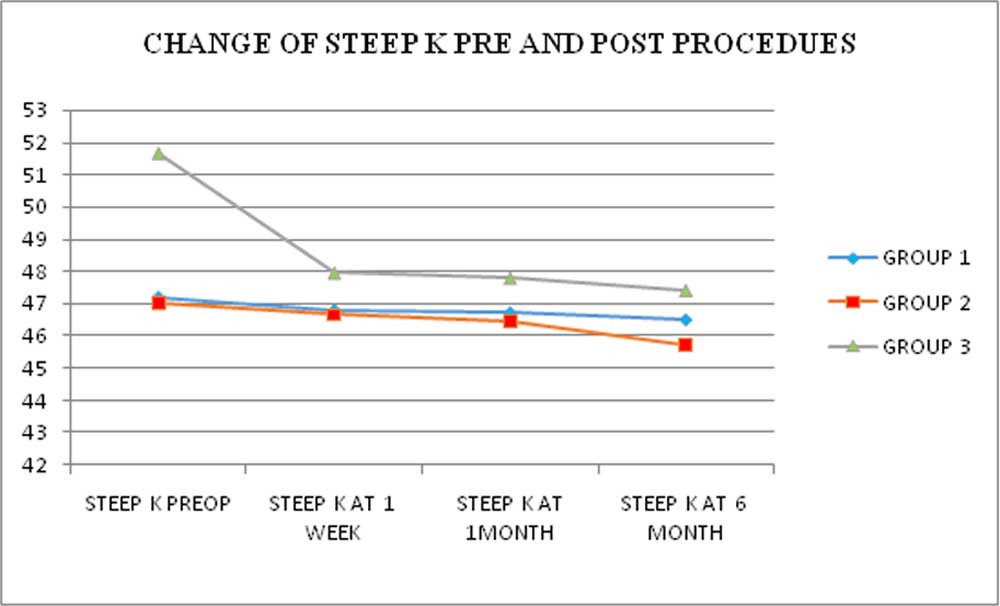
C3R with INTACS showed considerable reduction in the steep K value. C3R and C3R with PRK groups also showed reduction in steep K values and the reduction remained stable throughout the post op period.
OBSERVATION OF CHANGE IN FLAT K PRE AND POST PROCEDURES
Table 7
| FLAT K PREOP | FLAT K AT
1 WEEK |
FLAT K AT
1 MONTH |
FLAT K
AT 6 MONTHS |
|
| GROUP 1 | 45.3 | 45 | 44.9 | 44.9 |
| GROUP 2 | 43.2 | 43.2 | 43.4 | 43 |
| GROUP 3 | 45.6 | 42.9 | 42.9 | 42.6 |
Graph 7
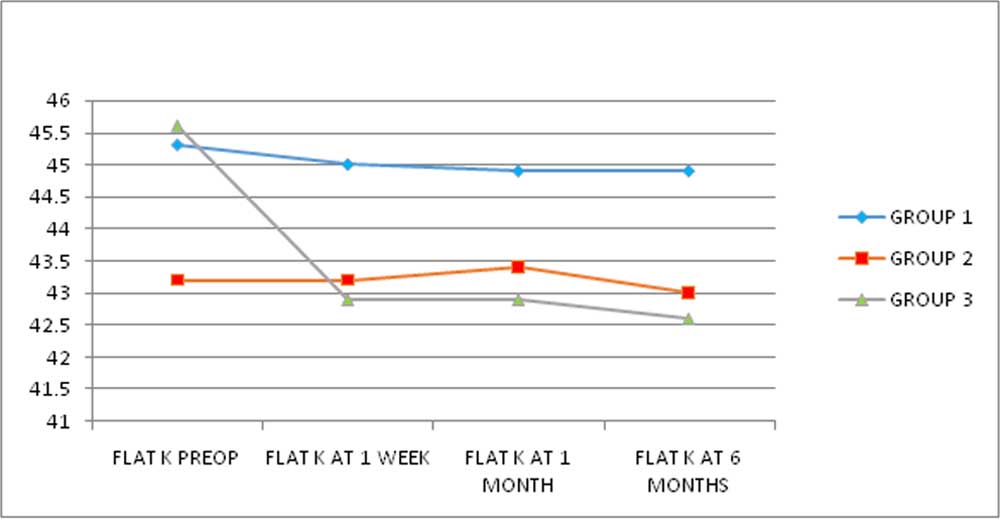
Group 3 subjects seemed to have undergone the most effective procedure in reducing the flat K parameter. Group 2 subjects had an initial worsening of the flat K and then after 1 month post procedure showed gradual improvement of the flat K value. Group 1 subjects showed a steady decrease in flat K value following the procedure.
OBSERVATION OF CHANGE IN TOPOGRAPHIC ASTIGMATISM PRE AND POST PROCEDURES
Table 9
| TOPO-ASTIG PREOP | TOPO-ASTIG AT I WEEK | TOPO-ASTIG 1 MONTH | TOPO-ASTIG 6 MONTHS | |
| GROUP 1 | 1.9 | 1.8 | 1.9 | 1.7 |
| GROUP 2 | 3.9 | 3.5 | 3.1 | 2.7 |
| GROUP3 | 6 | 5 | 4.9 | 4.8 |
Graph 9
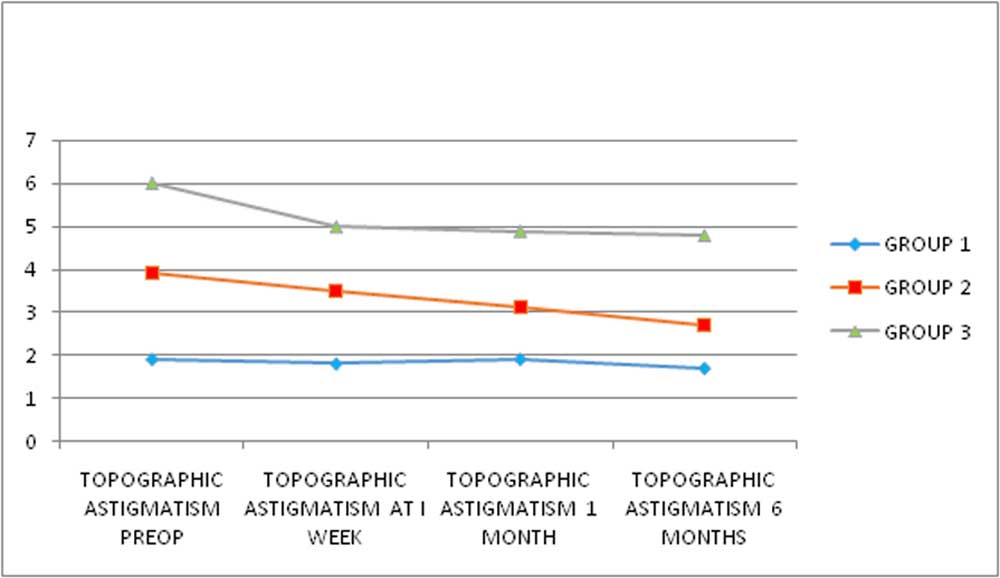
At 6 months review, all three groups showed reduction in astigmatism value obtained using a Corneal topograph.
OBSERVATION OF THE EFFECTIVENESS OF THE PROCEDURES ON UCVA – SHOWN IN COMPARISON
Table 10
| UCVA |
P VALUE |
|
| GROUP 1 | -0.3 ± 0.2 |
0.00 |
| GROUP 2 | 0.3 ± 0.3 |
0.00 |
| GROUP 3 | 0.1 ± 0.2 |
0.02 |
Graph 10
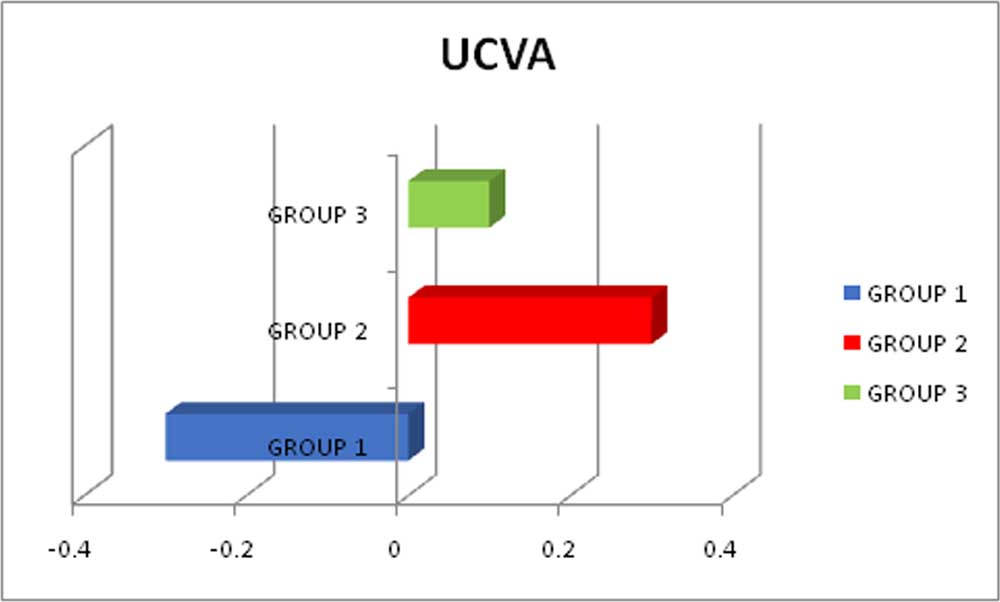
Group 2 procedure seems to be effective in the betterment of UCVA in comparison to Group 3 and Group 1. Both Group 3 and Group 2 subjects have shown statistically significant betterment of UCVA. Whereas Group 1 subjects have shown worsening of UCVA, post procedure.
OBSERVATION OF THE EFFECTIVENESS OF THE PROCEDURES ON BCVA – SHOWN IN COMPARISON
Table 11
| BCVA |
P VALUE |
|
| GROUP 1 | -0.01 ± 0.1 |
0.66 |
| GROUP 2 | 0.1 ± 0.2 |
0.03 |
| GROUP 3 | 0.1 ± 0.2 |
0.00 |
Graph 11
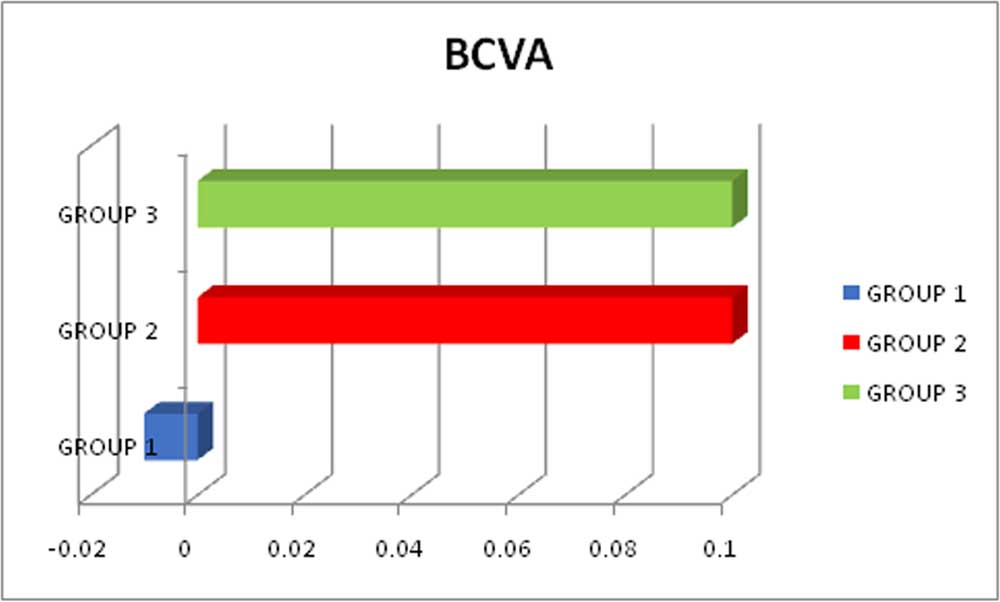
Both Group 2 and Group 3 have shown improvement in the BCVA post procedure, but the improvement in Group 2 alone has been found out to be statistically significant because the improvement in Group 2 has been found to be consistent in all subjects in comparison to Group 3. The improvement in Group 3 in certain subjects has been large, accounting to the comparable improvement on the graph but the statistical significance projects its inconsistency.
OBSERVATION OF THE EFFECTIVENESS OF THE PROCEDURES ON SPHERE – SHOWN IN COMPARISON
Table 12
| SPHERE |
P VALUE |
|
| GROUP 1 | -0.16 ± 0.5 |
0.22 |
| GROUP 2 | -0.4 ± 1.9 |
0.44 |
| GROUP 3 | -1.3 ± 2.9 |
0.06 |
Graph 12
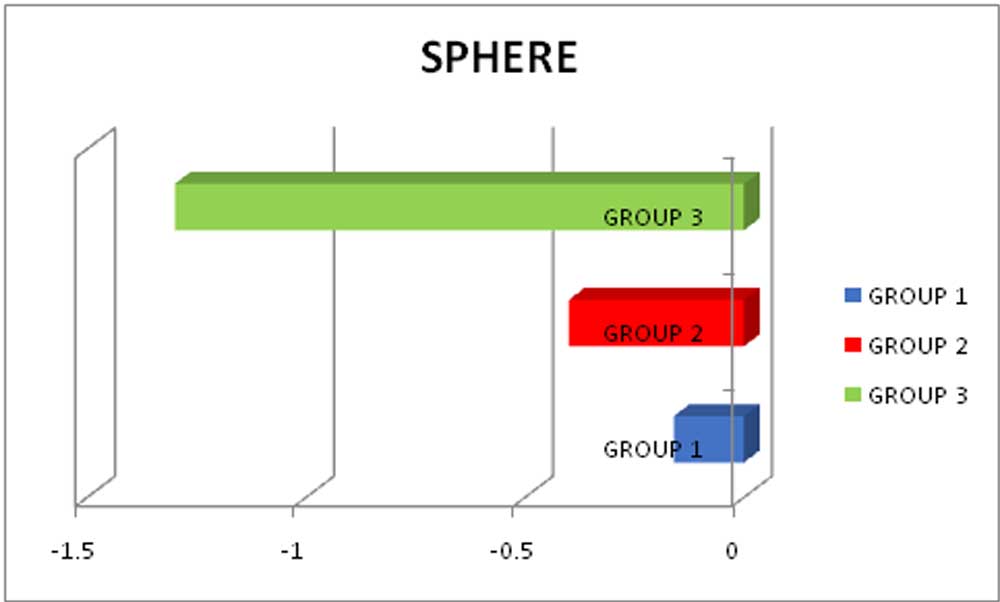
All three groups have shown reduction in the spherical refractive power but none of the reduction is statistically significant according to the paired T test.
OBSERVATION OF THE EFFECTIVENESS OF THE PROCEDURES ON CYLINDER – SHOWN IN COMPARISON
Table 13
| CYLINDER |
P VALUE |
|
| GROUP 1 | 0.2 ± 0.3 |
0.02 |
| GROUP 2 | -1.3 ± 1.2 |
0.00 |
| GROUP 3 | -2.5 ± 1.6 |
0.00 |
Graph 13
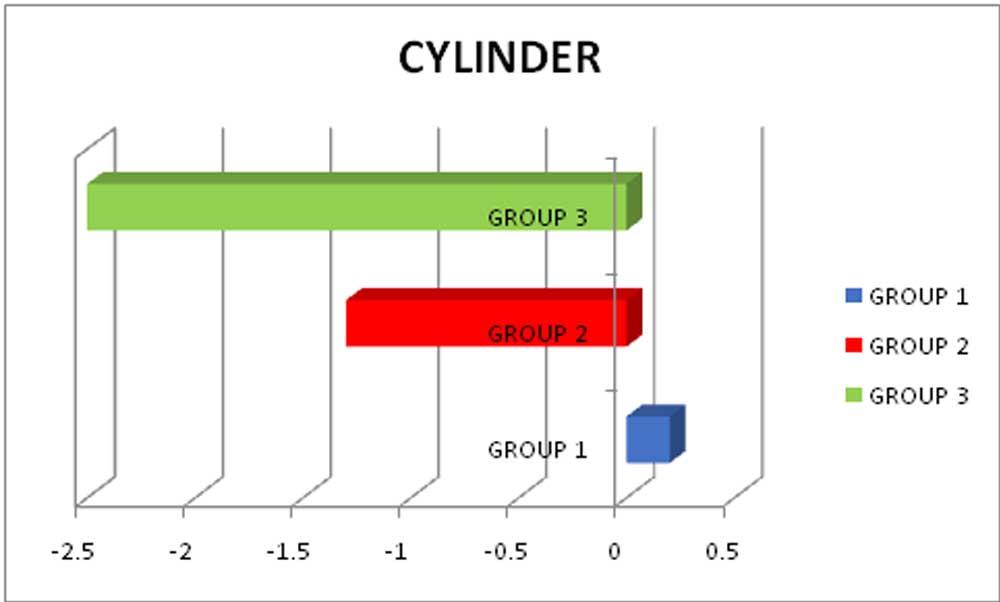
Both Group 2 and Group 3 procedures have shown statistically significant reduction in the cylinder value and thereby their effectiveness in doing so. Group 1 procedure has not been effective in reduction of the cylinder value.
OBSERVATION OF THE EFFECTIVENESS OF THE PROCEDURES ON STEEP K – SHOWN IN COMPARISON
Table 14
| STEEP K |
P VALUE |
|
| GROUP 1 | 0.7 ± 0.6 |
0.00 |
| GROUP 2 | 1.4 ± 1.0 |
0.00 |
| GROUP 3 | 4.2 ± 2.5 |
0.00 |
Graph 14
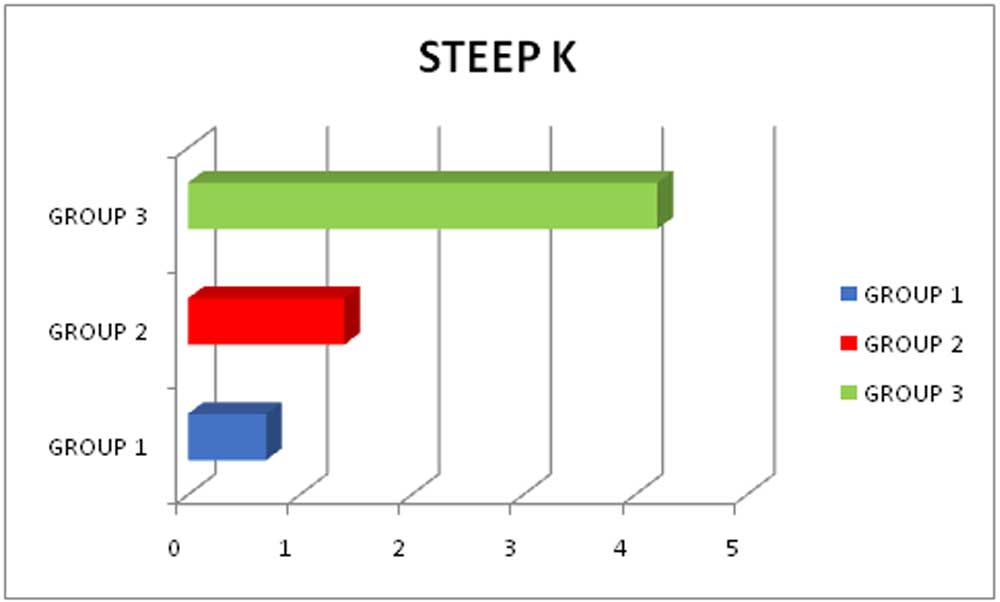
Statistically significant reduction of steep K value has been noted in all three groups following the procedure with Group 3 procedure being the most effective in doing so and Group 1 being the least effective amongst the three.
OBSERVATION OF THE EFFECTIVENESS OF THE PROCEDURES ON FLAT K – SHOWN IN COMPARISON
Table 15
| FLAT K |
P VALUE |
|
| GROUP 1 | 0.4 ± 0.8 |
0.03 |
| GROUP 2 | 0.1 ± 0.8 |
0.50 |
| GROUP 3 | 3 ± 1.9 |
0.00 |
Graph 15
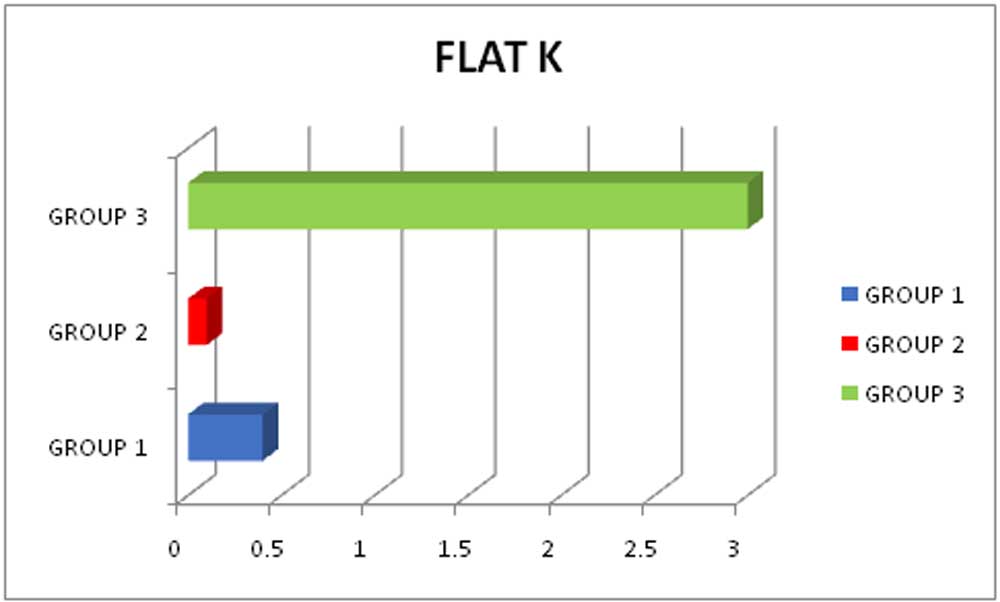
Flat K reduction by Group 3 and Group 1 has been statistically significant in comparison to Group 2, whose reduction is not statistically significant. Group 3 procedures reduction of Flat K value has been the most effective.
OBSERVATION OF THE EFFECTIVENESS OF THE PROCEDURES ON TOPOGRAPHIC ASTIGMATISM – SHOWN IN COMPARISON
Table 16
| TOPOGRAPHIC ASTIGMATISM |
P VALUE |
|
| GROUP 1 | 0.3 ± 0.4 |
0.02 |
| GROUP 2 | 1.2 ± 1.3 |
0.00 |
| GROUP 3 | 1.2 ± 2.0 |
0.02 |
Graph 16
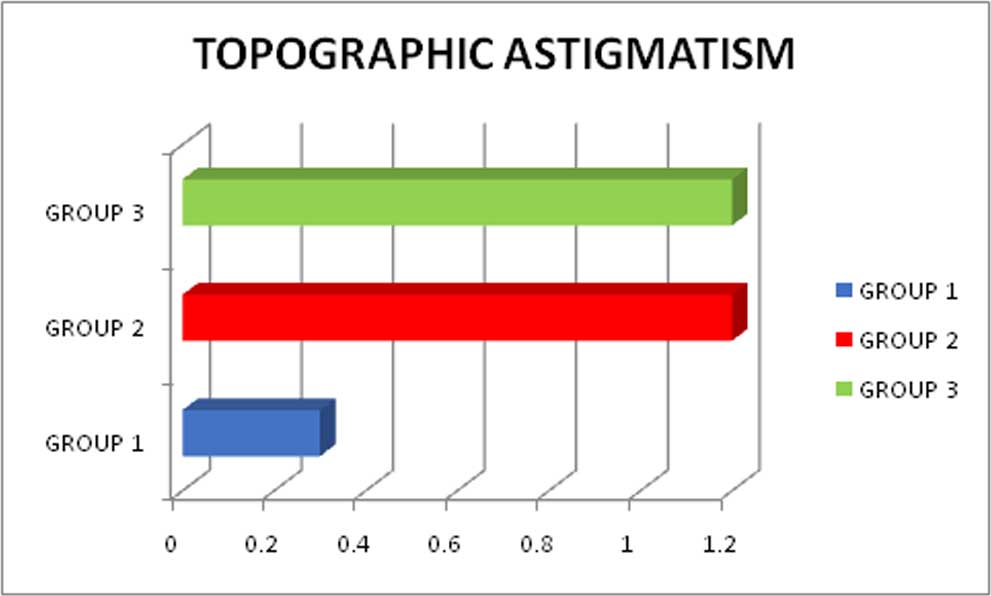
All three groups have shown statistically significant reduction of the astigmatism documented by corneal topography, at the end of 6 months – post procedure. Both Group 2 and Group 3 have shown comparable reduction of astigmatism.
CONCLUSION
Corneal collagen crosslinking has showed good results in improving the topographic parameters though improvement of the visual acuity and manifest refraction has not been much promising.
Topo-guided PRK with C3R and Intacs with C3R have showed remarkable corneal topographic outcomes by flattening the cone and improvement in the overall shape.
Intacs followed by C3R appears to be the most promising procedure among all the three in improving the Visual acuity (UCVA and BCVA), Manifest refraction (Sphere and Cylinder) and the Topographic parameters, chronologically followed by Topo-guided PRK with C3R and the last being C3R alone in the management of Keratoconus
Our study suggests that the combined procedures are more effective approach in not only biomechanically stabilizing the cornea in keratoconus but also in improving the overall corneal contour, reducing irregular astigmatism and improving the vision with glasses and contact lenses. Thus offering a better visual rehabilitation for the patient.
These procedures also reduce or delay the need for corneal transplant by stabilizing the ectatic disorder.
Thus the results of our prospective, randomized study are quite promising and suggest a longer study to evaluate the long term safety and efficacy of these procedures in treating keratoconus.
REFERENCES?
Leave a Comment